Manufacturing Solution
Manufacturing Bottleneck Analysis
Comparing dwell records across processes narrows down where to look for a late delivery. Movement history for vehicles and assets stays on record and becomes the basis for reviewing production layout and plans.

Calculate dwell time for vehicles and assets to find bottlenecks
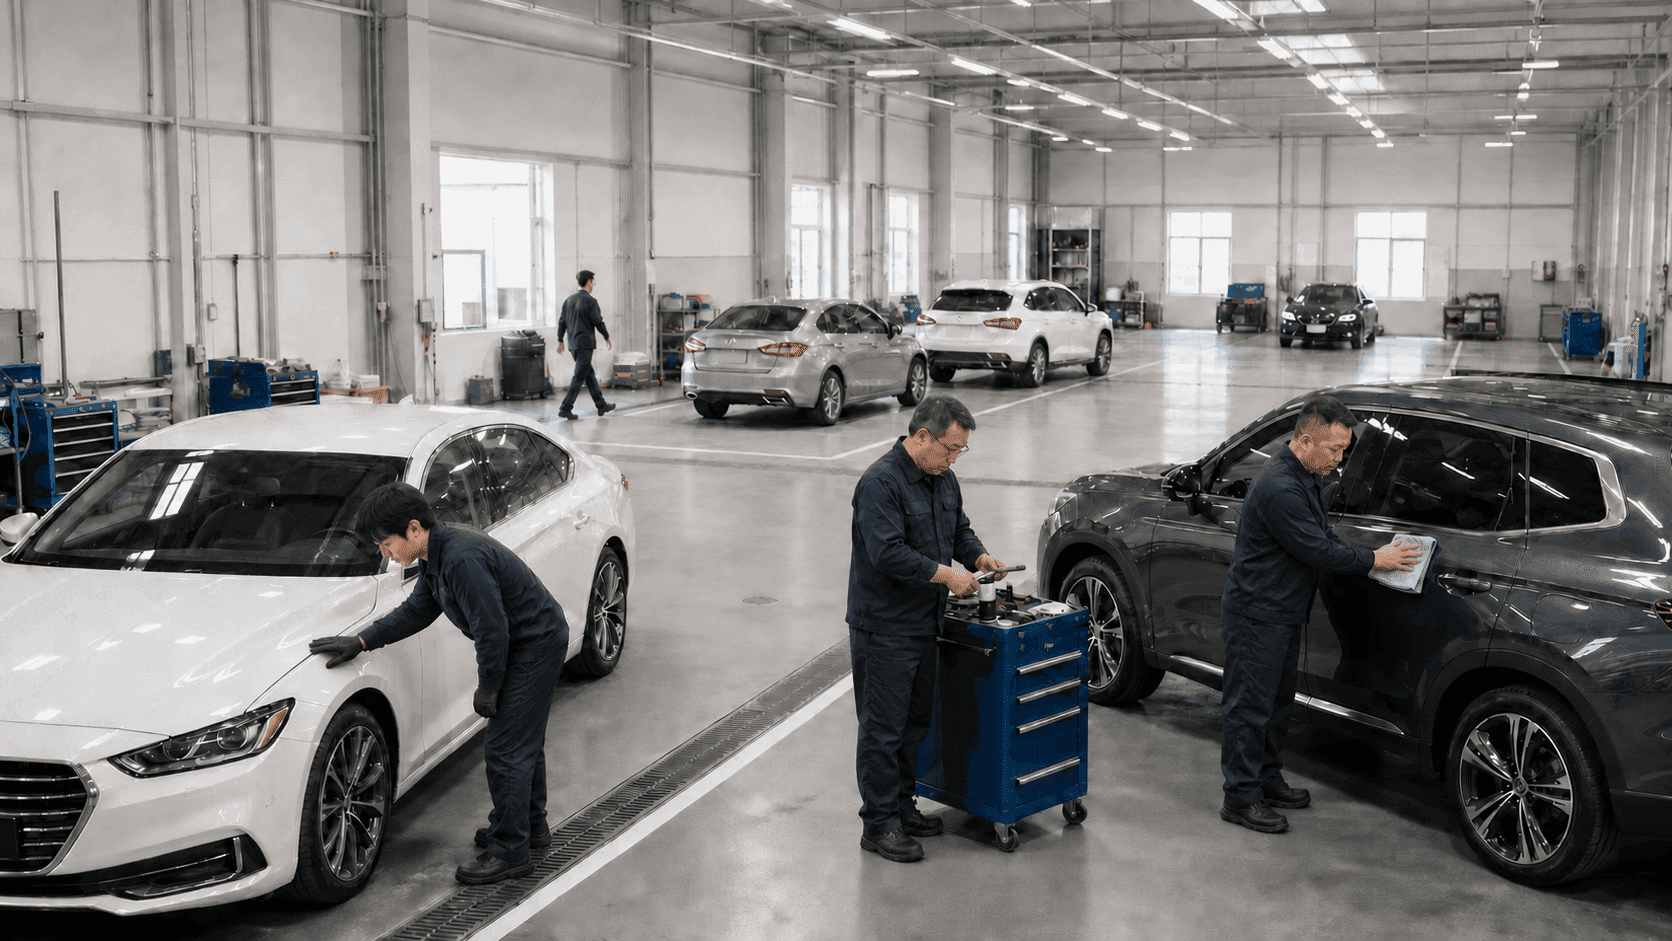
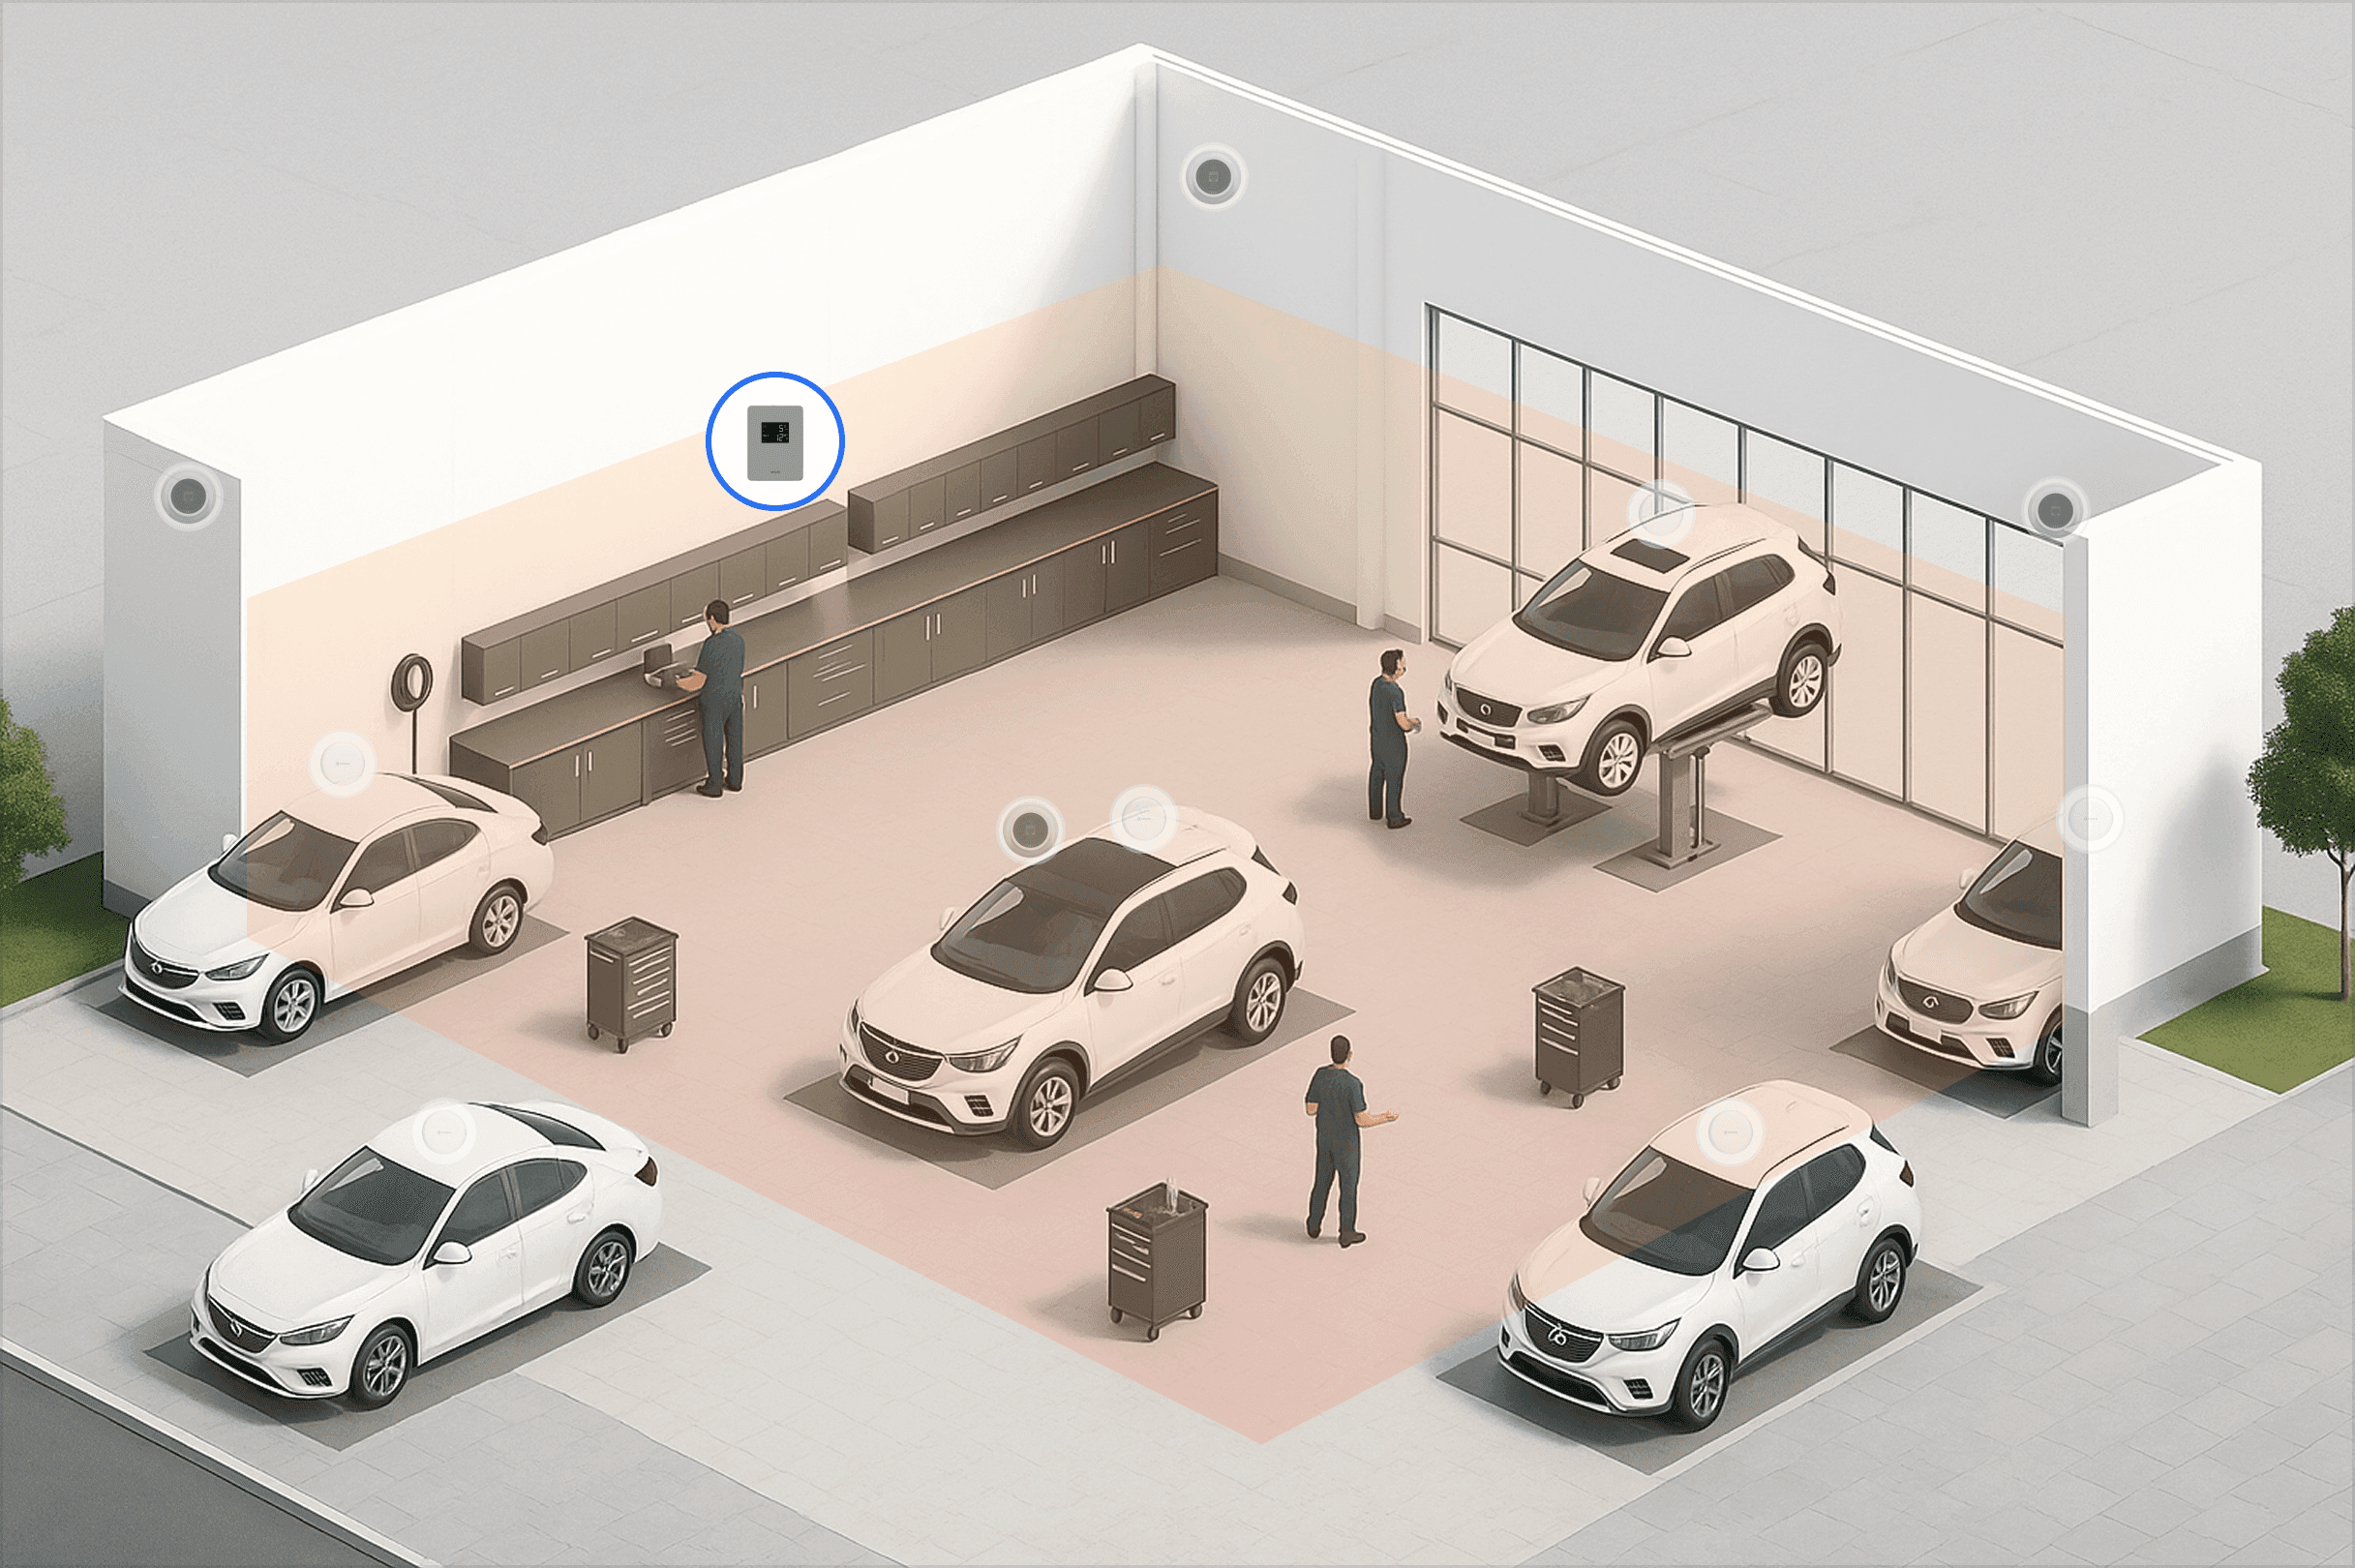
A UWB Tag goes on the vehicles and assets circulating through the plant, and TwinTracker UWB is mounted in every process zone. Zone entry and exit times are stored on ORBRO Server to calculate dwell time by process. Zones that use Plutocon Pro tell position apart through a linked BLE signal receiver.
TwinTracker UWB
A receiver that takes tag signals and calculates position. It follows many units at once, so even in front of a process where vehicles pile up it separates them one by one. Measuring with the equipment actually in place is what reveals the sections that get blocked.
Process Dwell Time Analysis
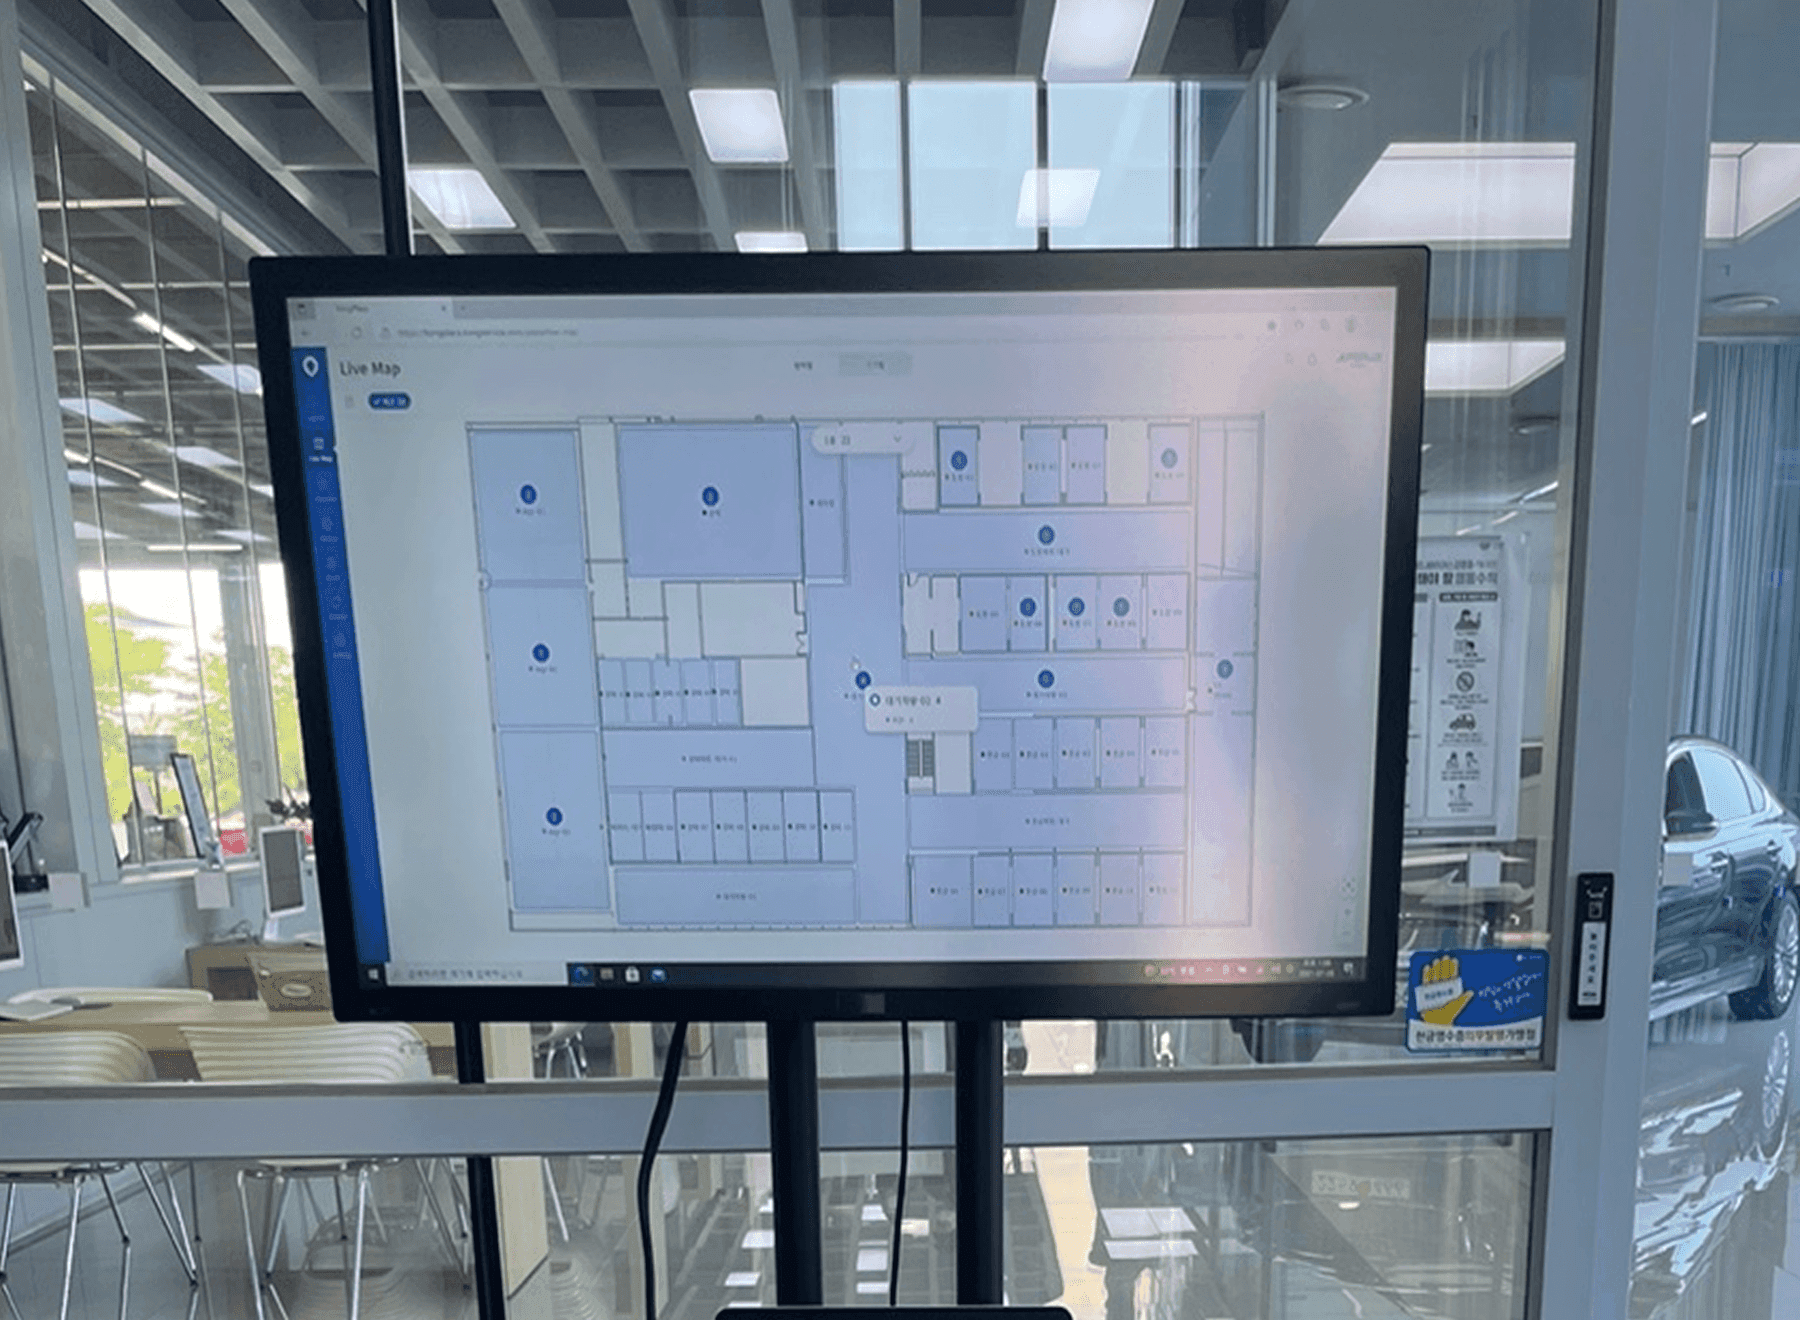
What is sitting in each process, how many, and the average dwell time are shown. Comparing the sections where things stay longest narrows what to check on the floor.
Checking progress at each process
The screen shows what has entered each process and how many. Sections running behind schedule alert the responsible staff before the delay sets in. Set the threshold time for those alerts separately for each process.
Comparing average dwell time by process
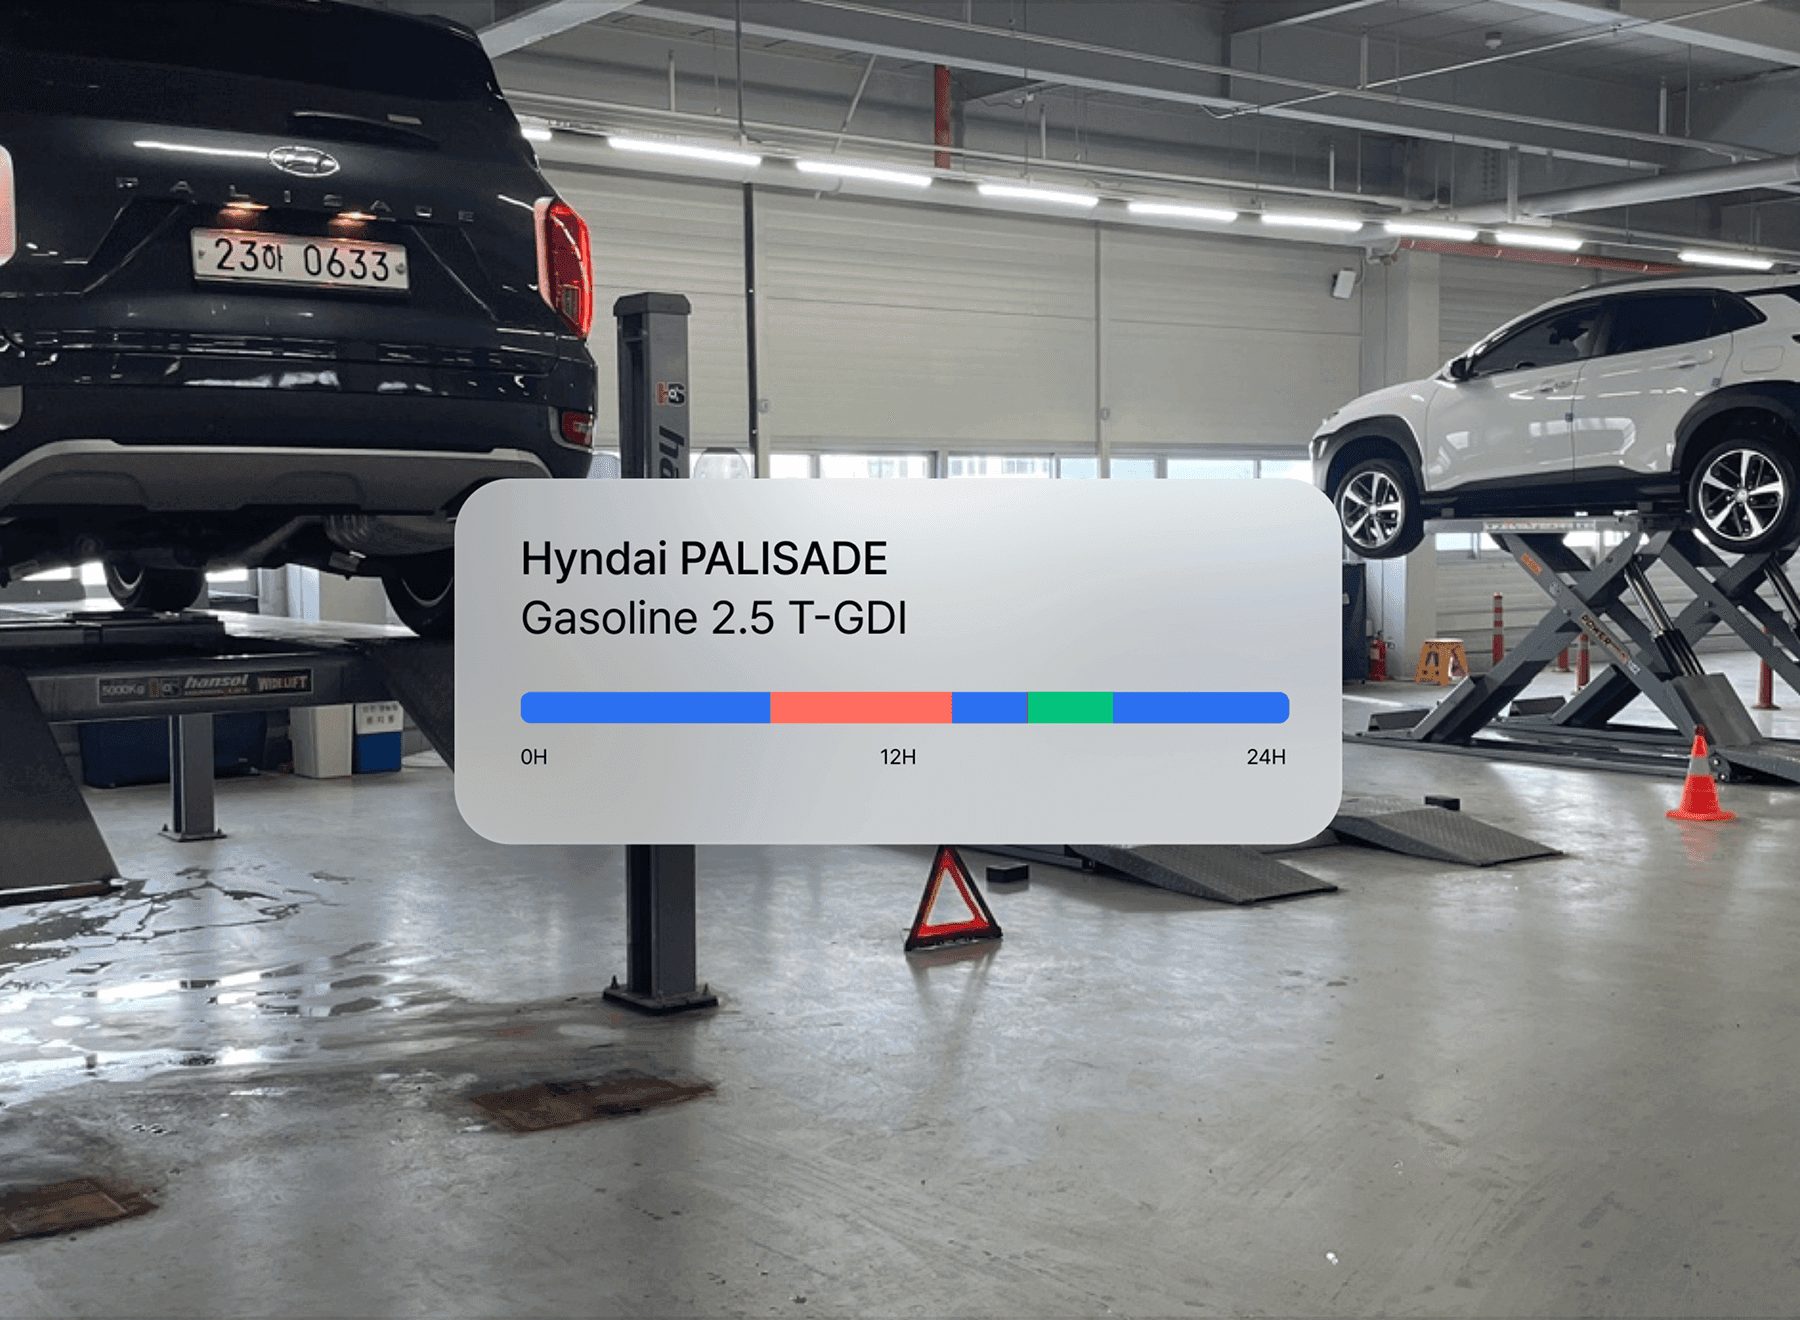
Average dwell time by process is calculated from the times of entering and leaving a zone. Sections where things stayed longest are marked out on screen, narrowing what staff need to check. Compare records for the same process over the same length of period to see how dwell time differed before and after a layout change.
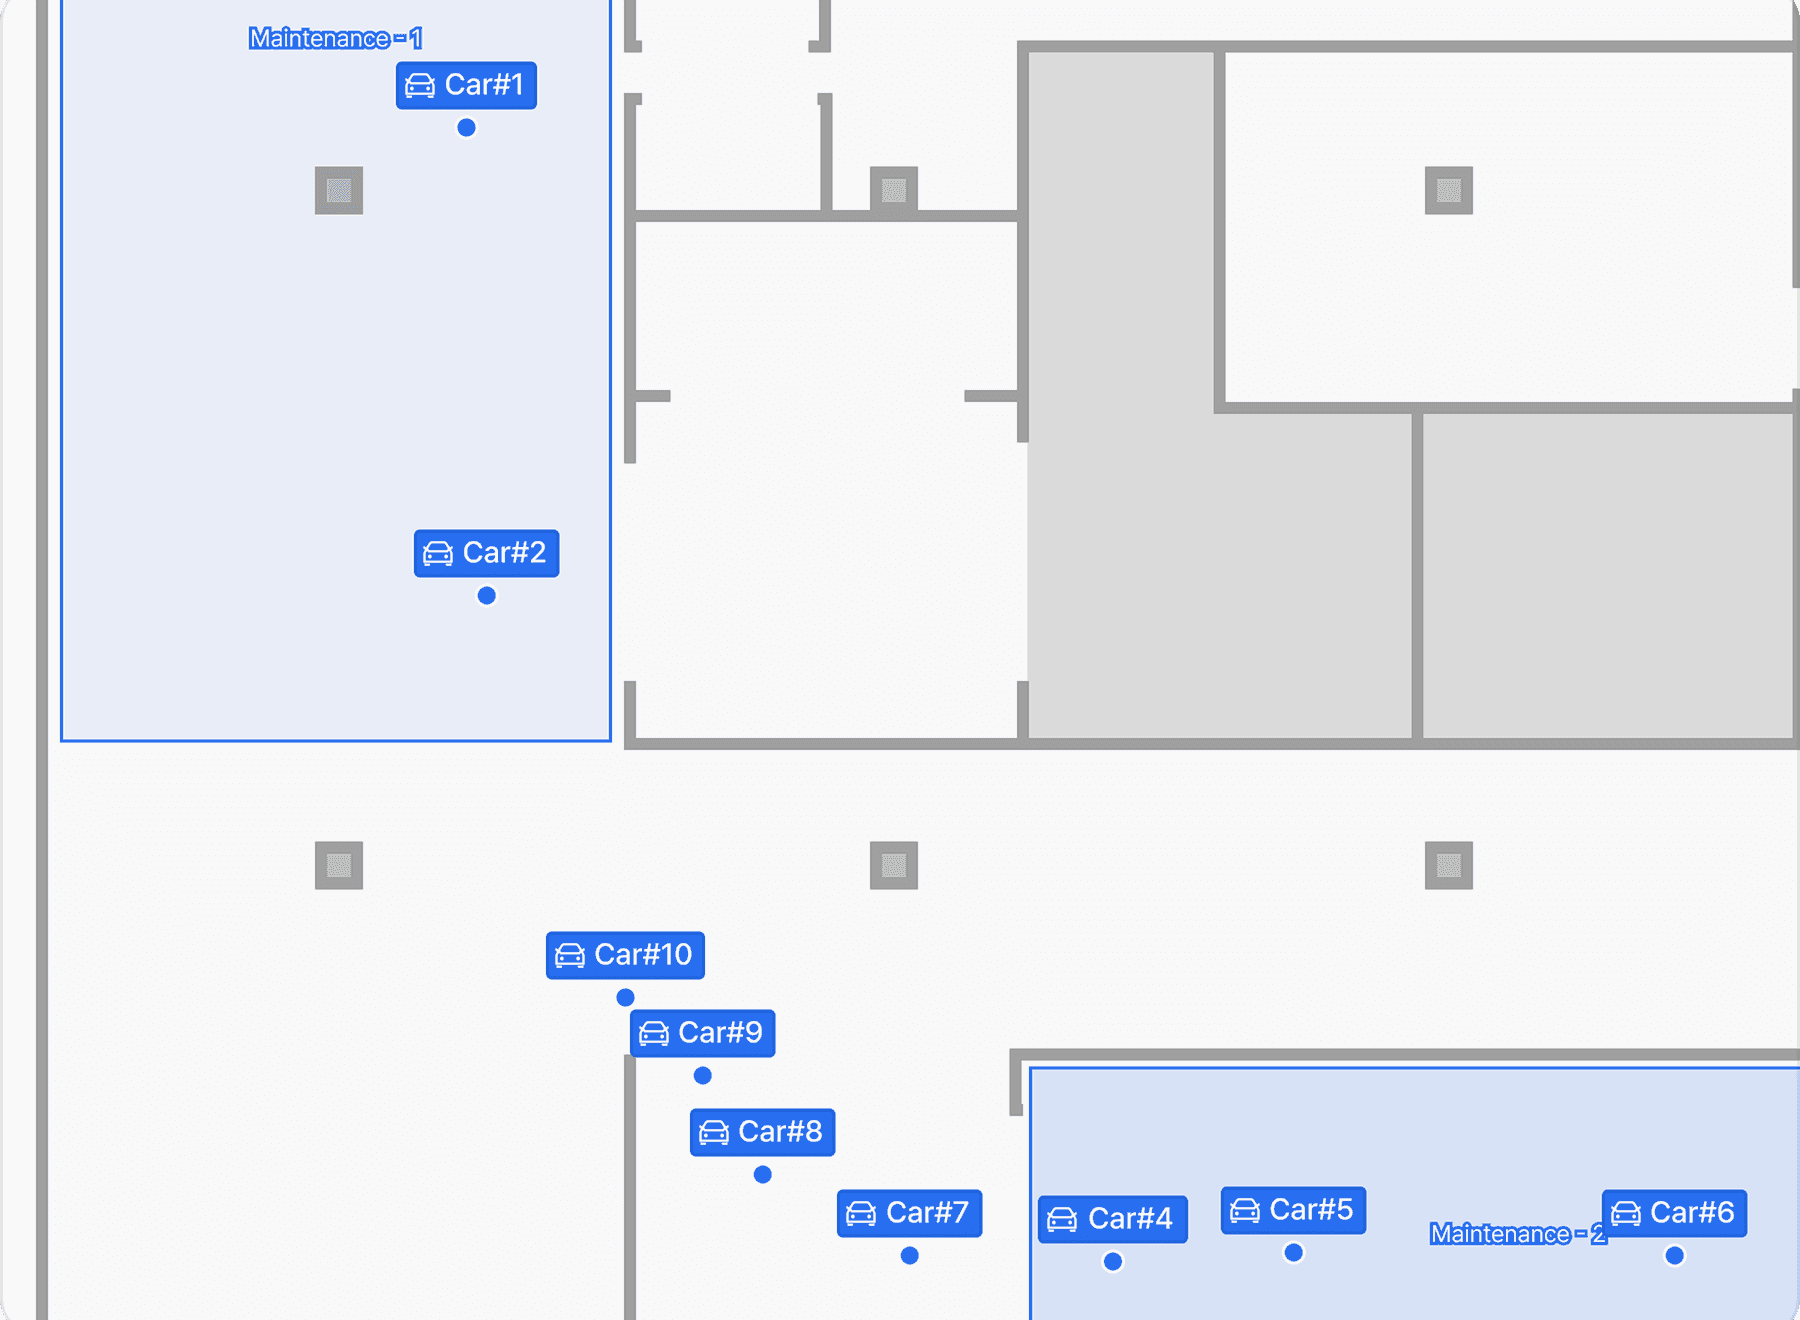
Recording movement paths for each vehicle
Which processes a single vehicle passed and in what order stays on record in time order. Paths that cover the same stretch several times surface and become the basis for redrawing routes. The lookup unit is the vehicle number, so staff can walk straight to it on the floor.
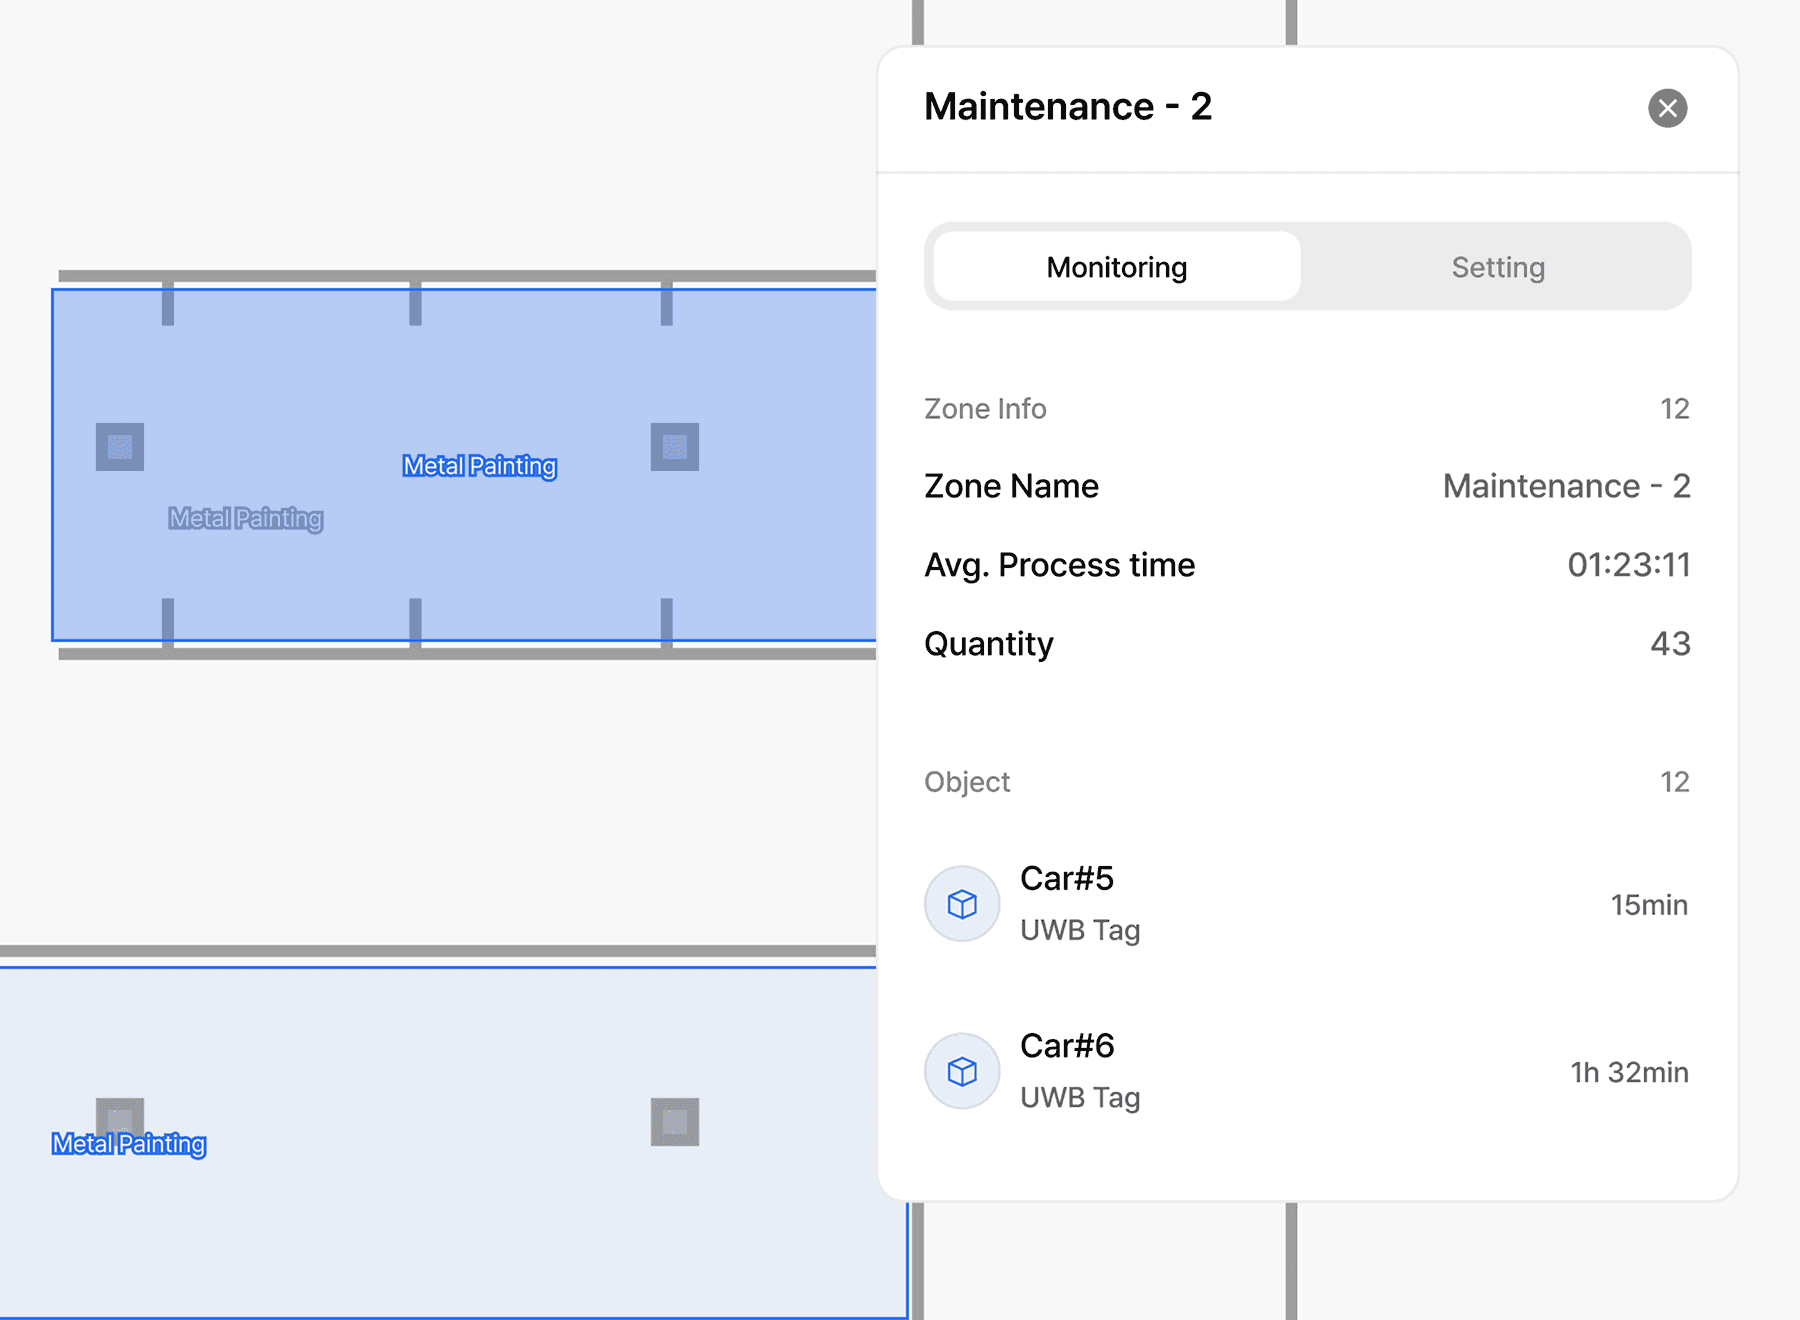
Checking quantity and congestion by zone
How many units are sitting in each zone is totaled as a number. Where the volume pushed out by the previous process has piled up becomes visible, pointing to the place congestion started. Zone boundaries are drawn on the floor plan to match the actual process layout.
Production System Data Integration
Location records are collected to suit the reception conditions of steel frame and outdoor sections. Dwell time by process is passed to the production management system and checked against work records.
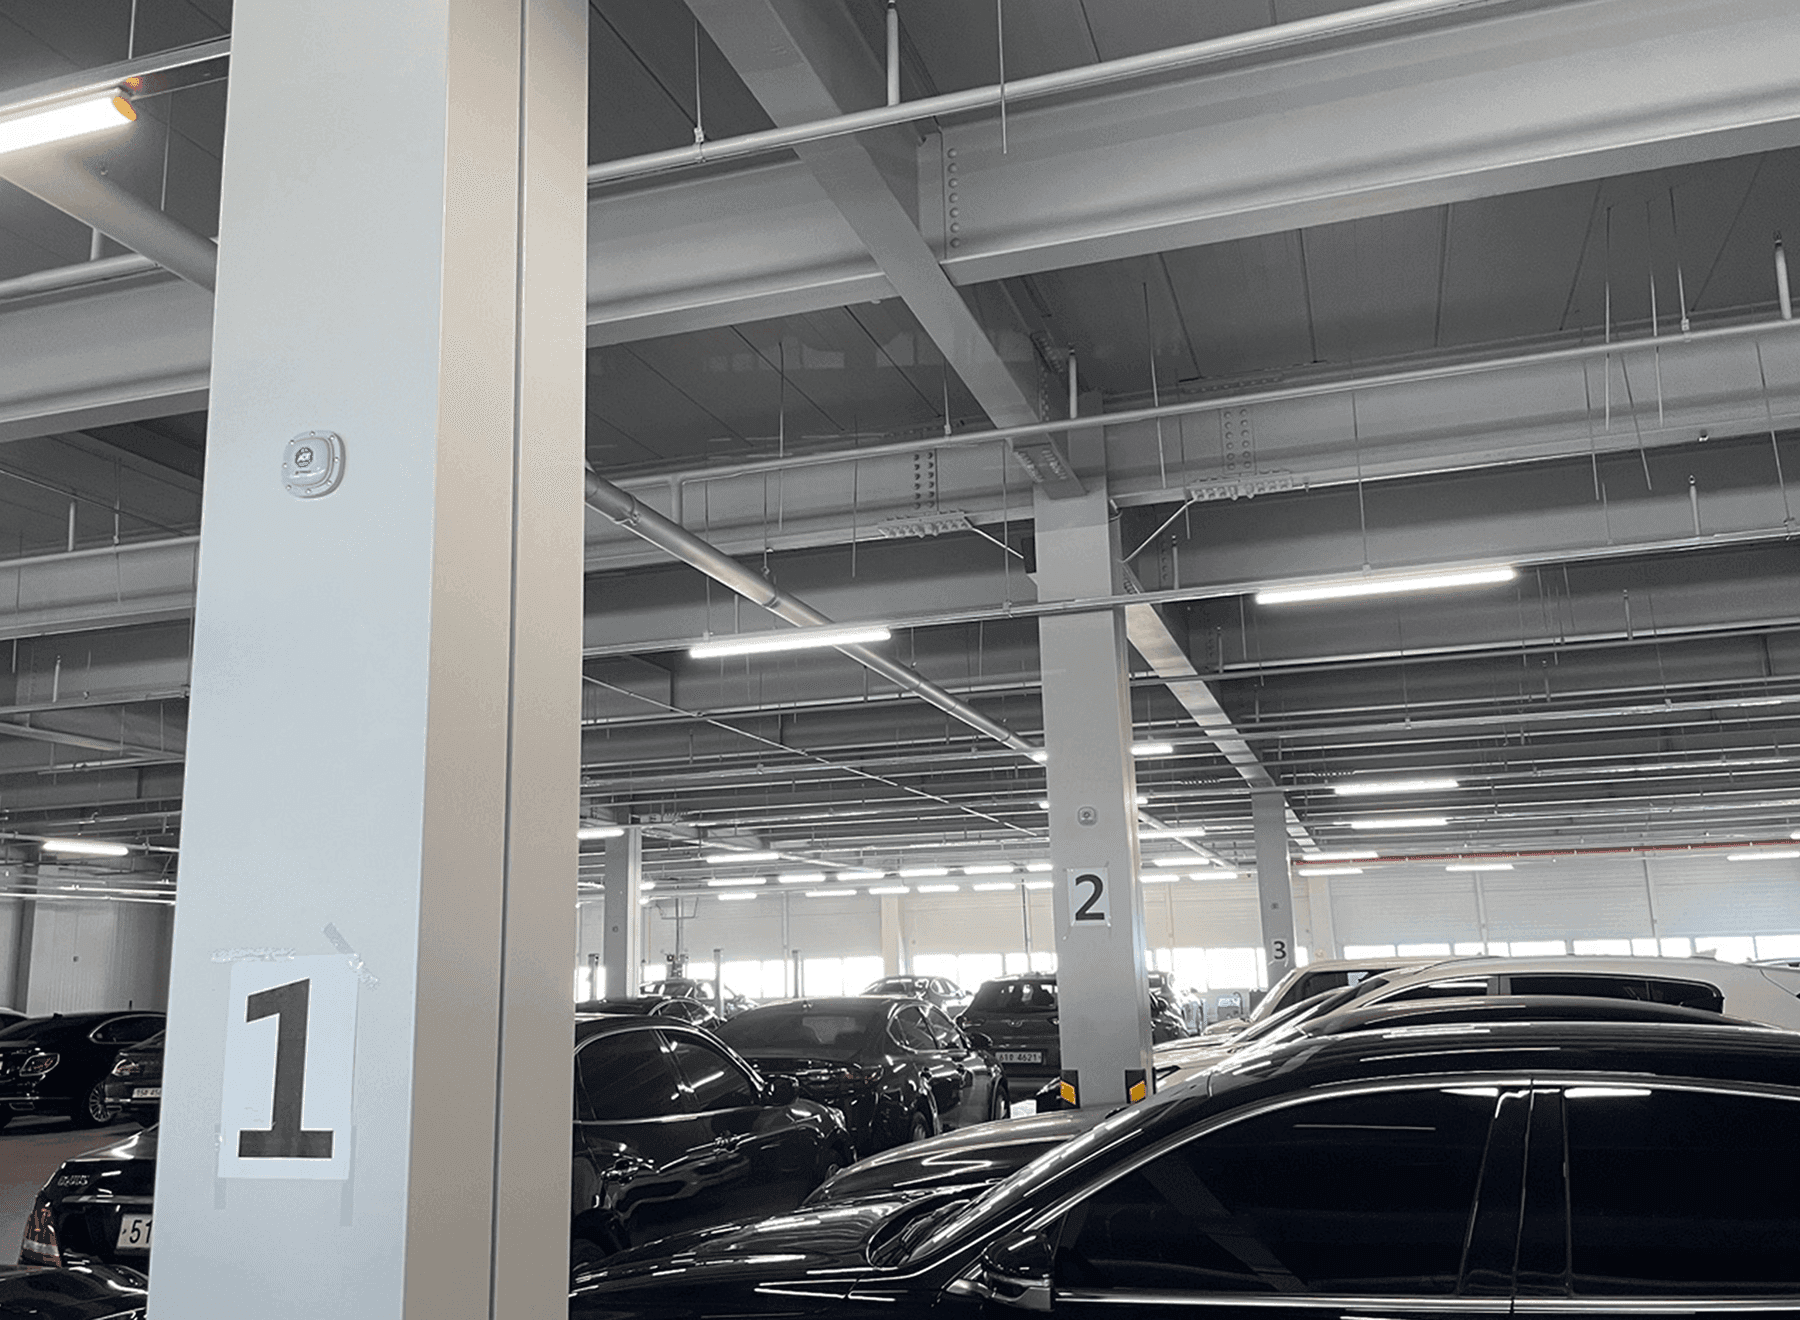
Passing on process zone numbers and locations
Each process zone carries a number, so the screen and the floor call it the same thing. Communication runs on which zone holds what, which drops the step of explaining it over the radio. The numbering scheme is set to match the process names already in use.
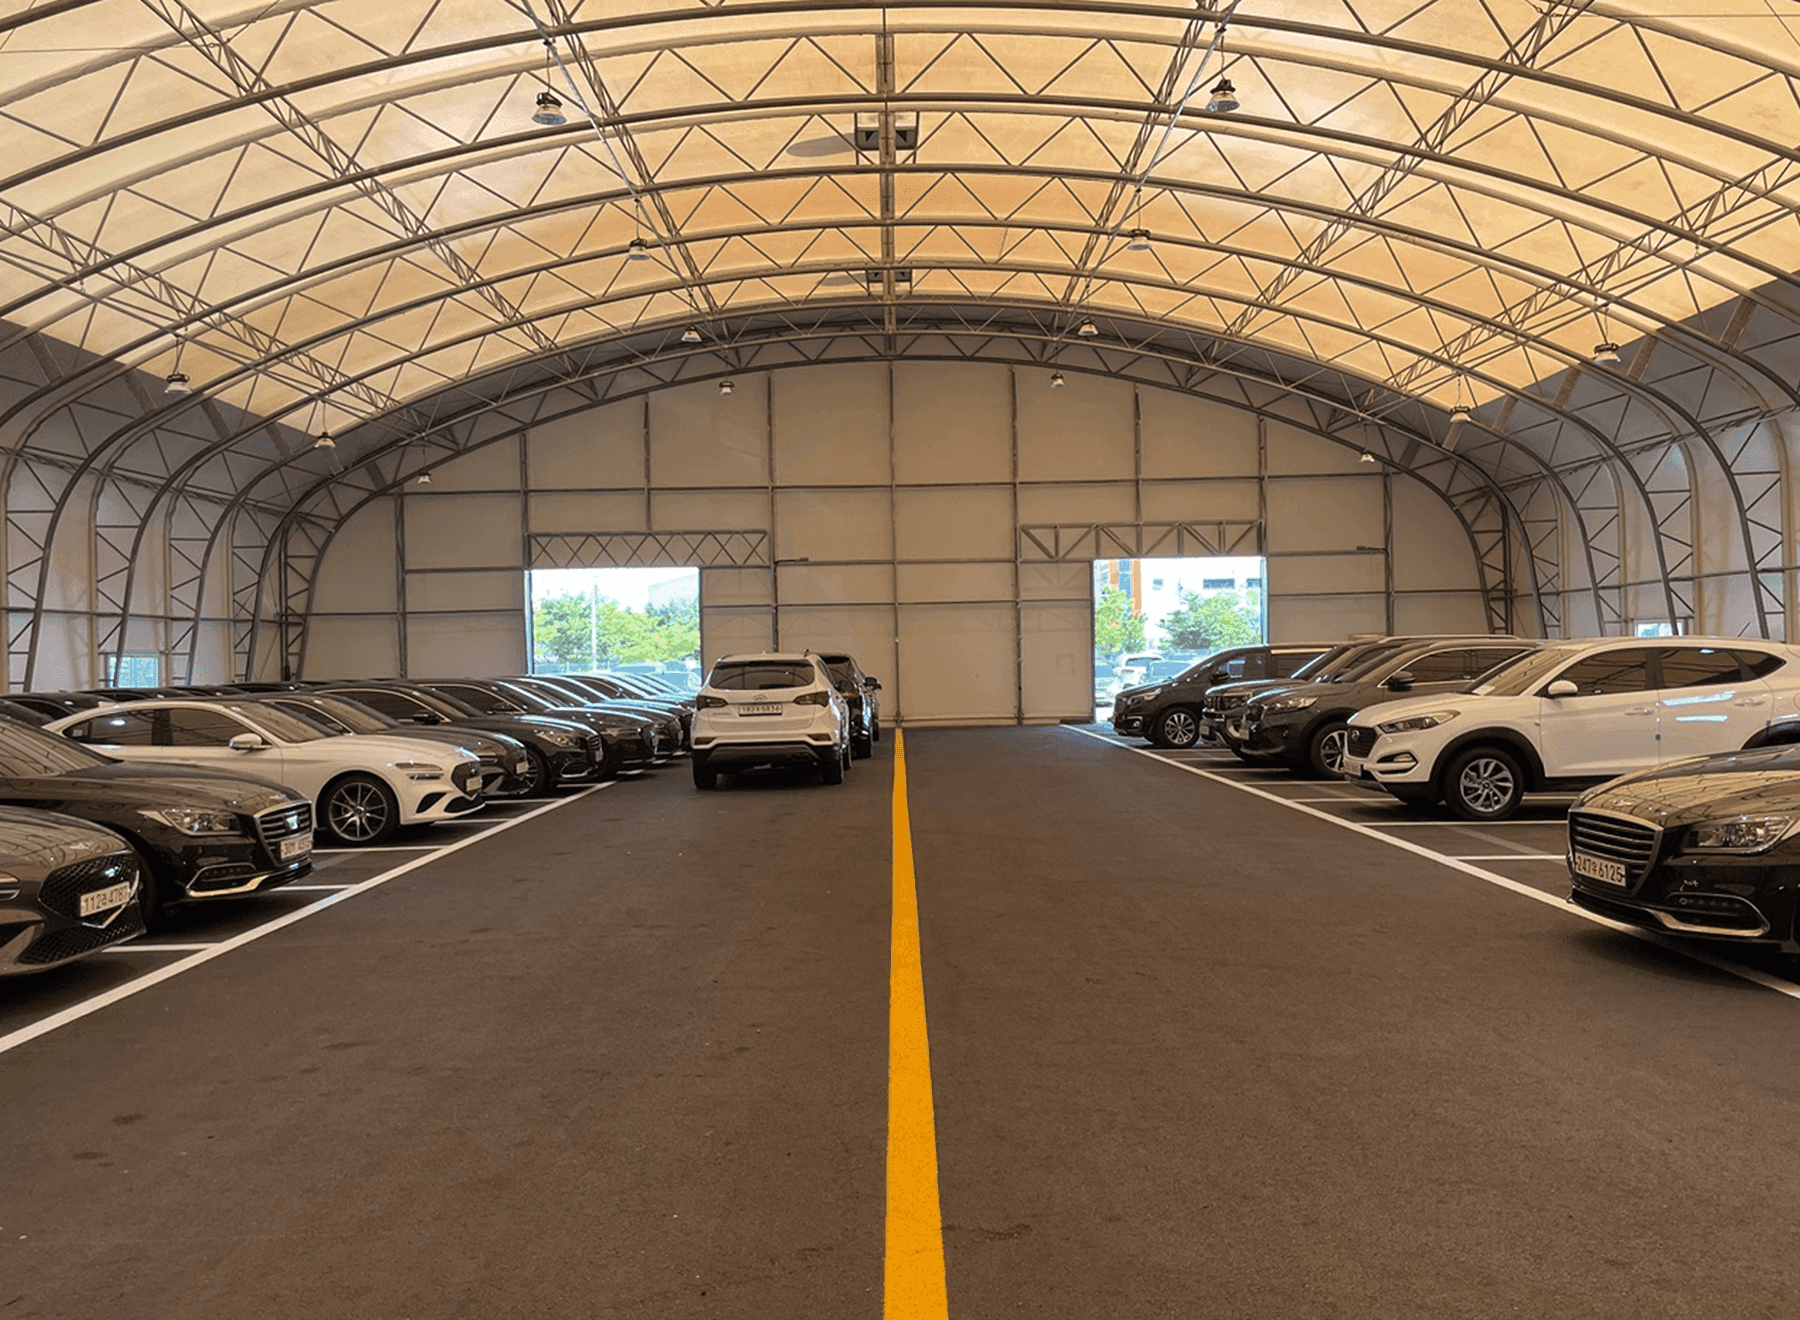
Handling steel frame, outdoor sections and network loss
Sections where the signal wavers, such as outdoor tents and steel frame annexes, are designed separately. While communication is down, records pile up on site and are pushed to the server once it returns. The missing stretch fills back in and the totals carry through unbroken.
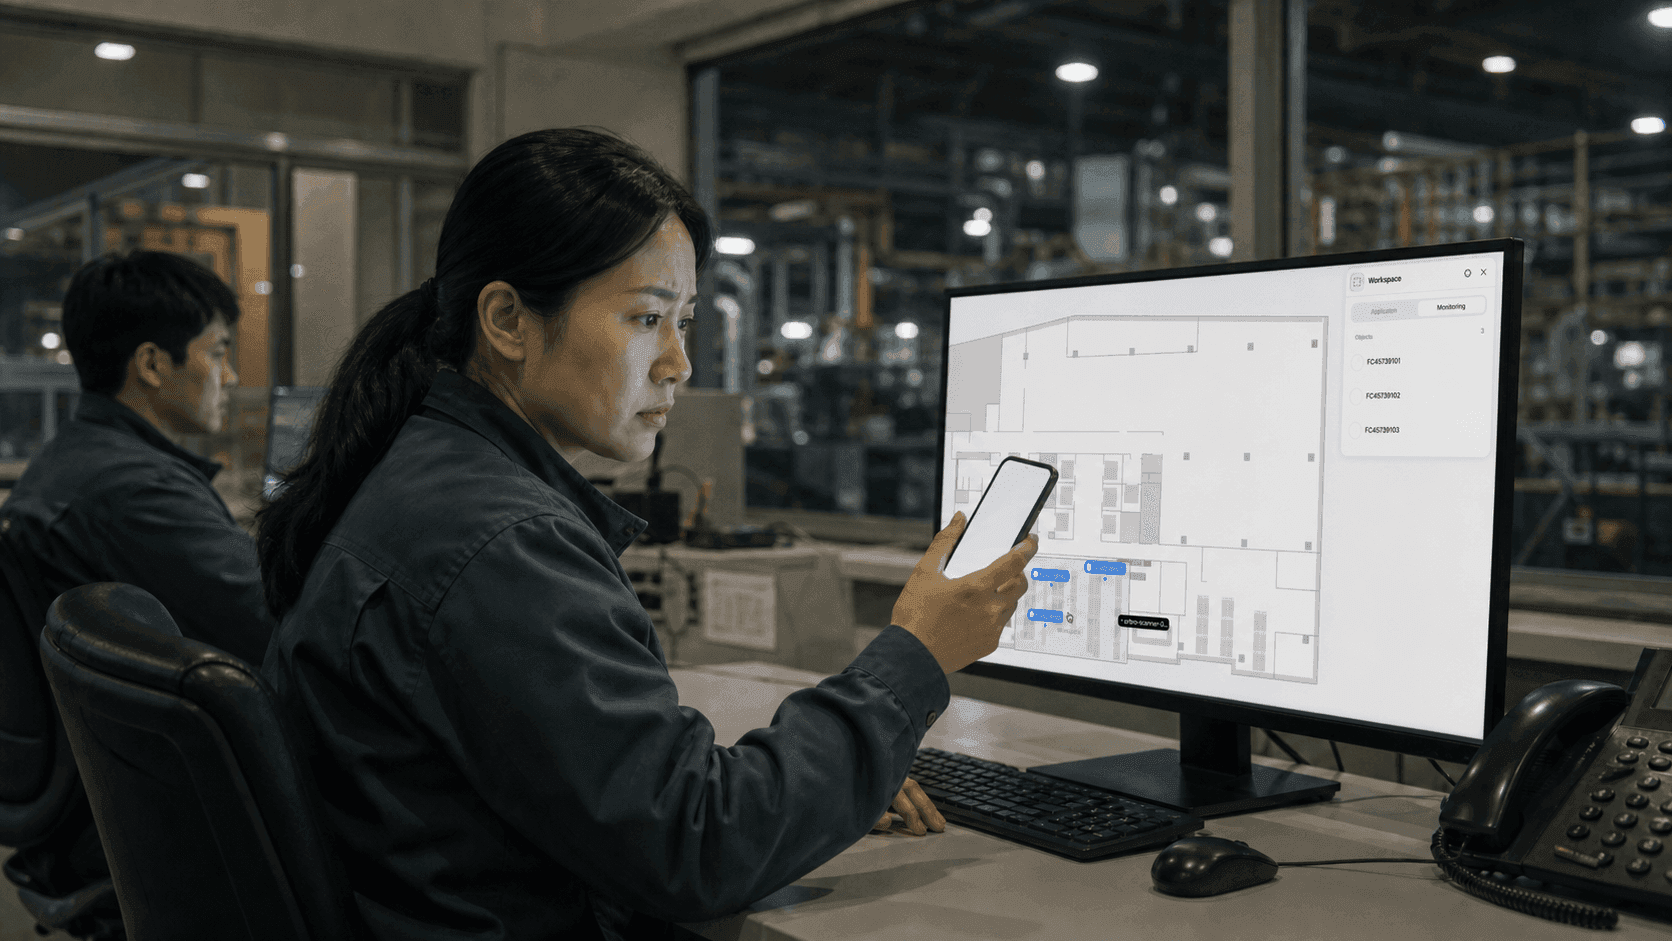
Mobile alerts and response on the floor
Process status and problem alerts reach the responsible staff on their phone. Without walking out to the floor, they can see which zone is held up and by what, and act on it. In multi-level plants, register recipients separately by floor.
Production management system integration
Process flow data moves into the production management system and is used for planning and dispatch alongside. Nobody has to copy results across by hand, which shortens the time reporting takes. Which fields transfer and how often is agreed against how far the customer system opens up.
Operations get sharper as process data accumulates
The time vehicles and work pieces spend passing through each process, and their movement records, accumulate. Beyond checking where something is now, you can find the causes behind repeated delays and compare, in data, the gap between the production plan and actual processing time as well as the change before and after an improvement.
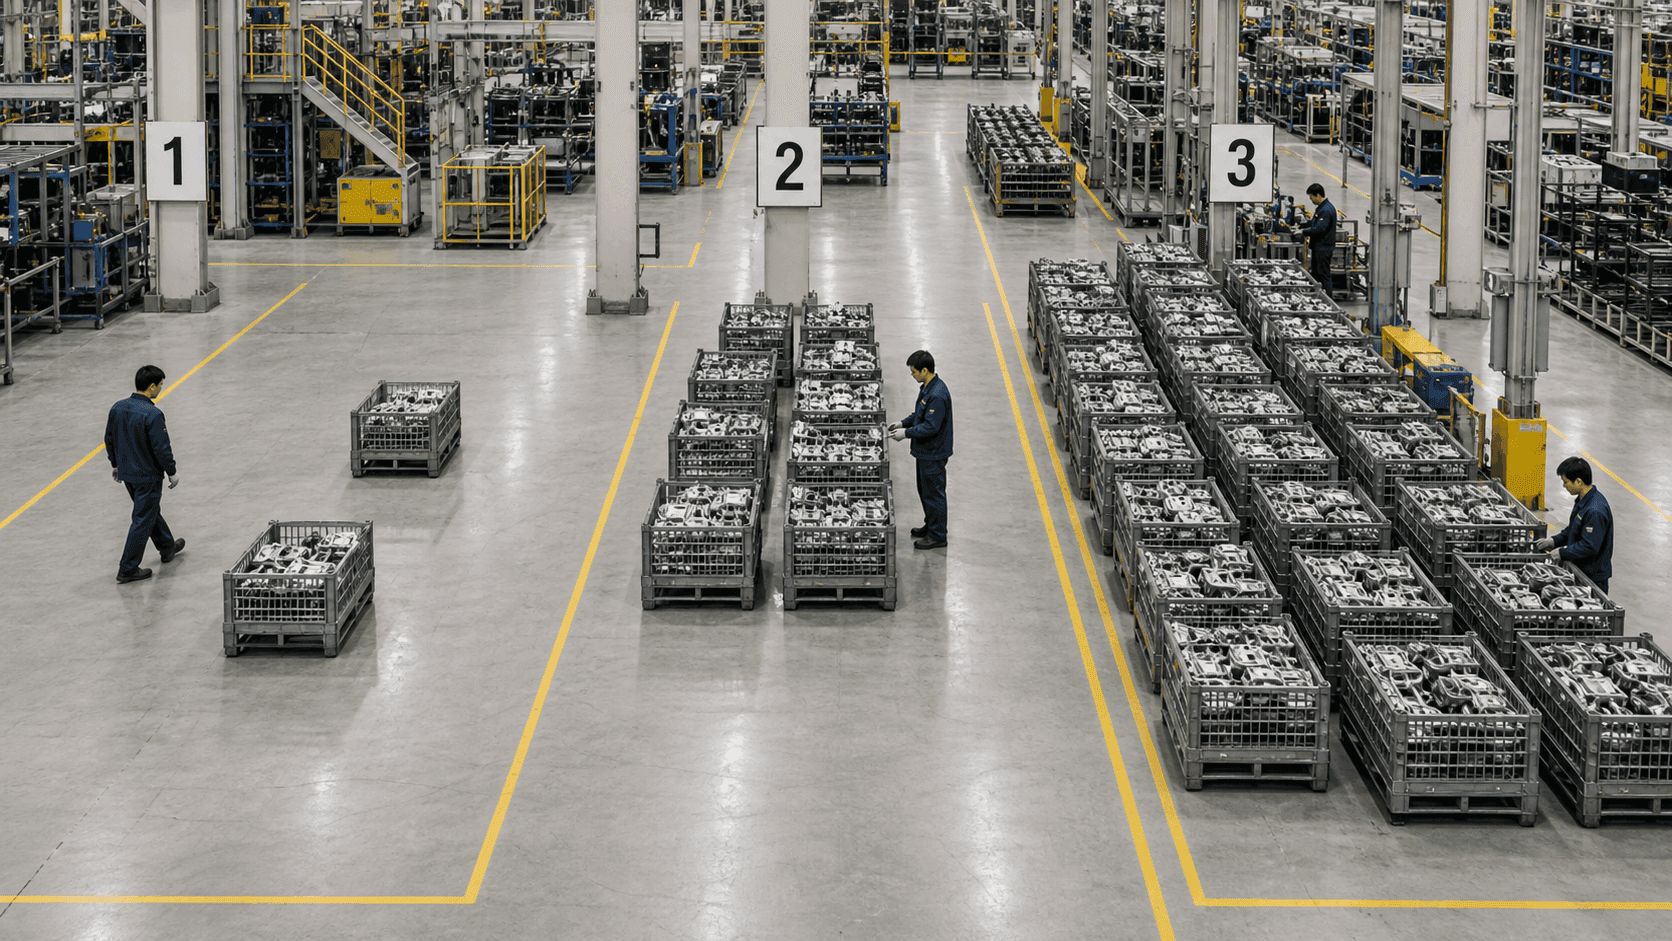
Analyzing bottlenecks that keep coming back
Comparing waiting quantity and dwell time by process separates a one-off delay from a structural bottleneck that repeats. Managers can start with the sections that need it most and adjust work sequence and staffing there first.
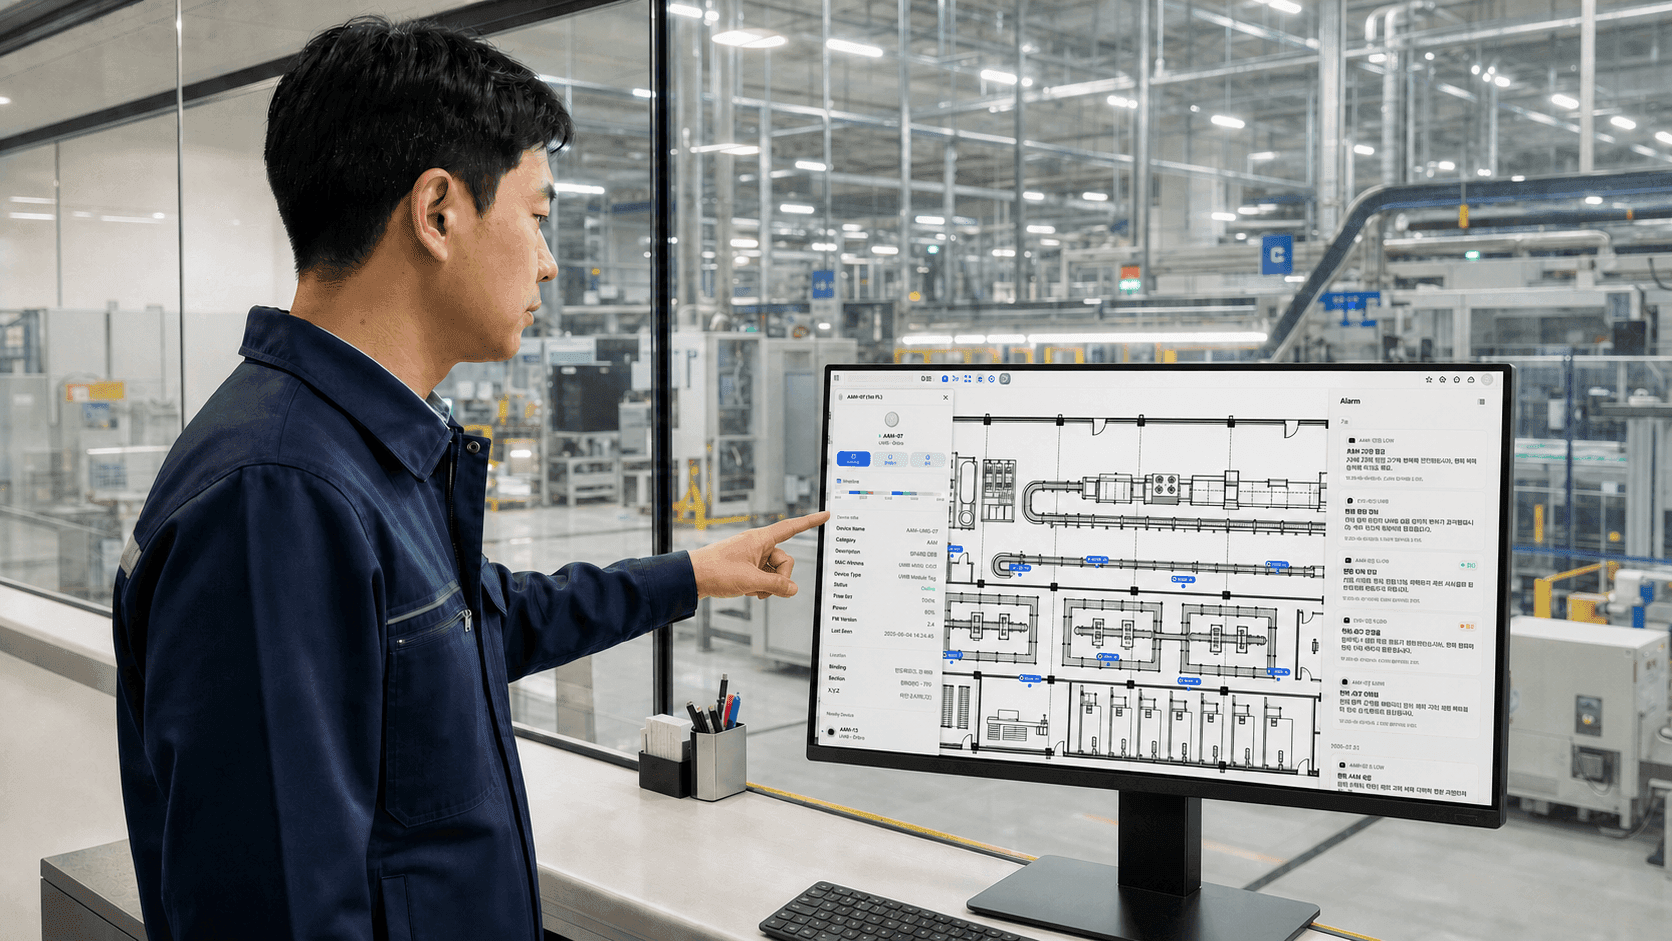
Comparing planned time with actual processing time
The standard time set in the production plan is compared process by process against the actual processing time measured on the floor. Identifying the sections where the gap widens again and again supports a more realistic production plan and work standard.
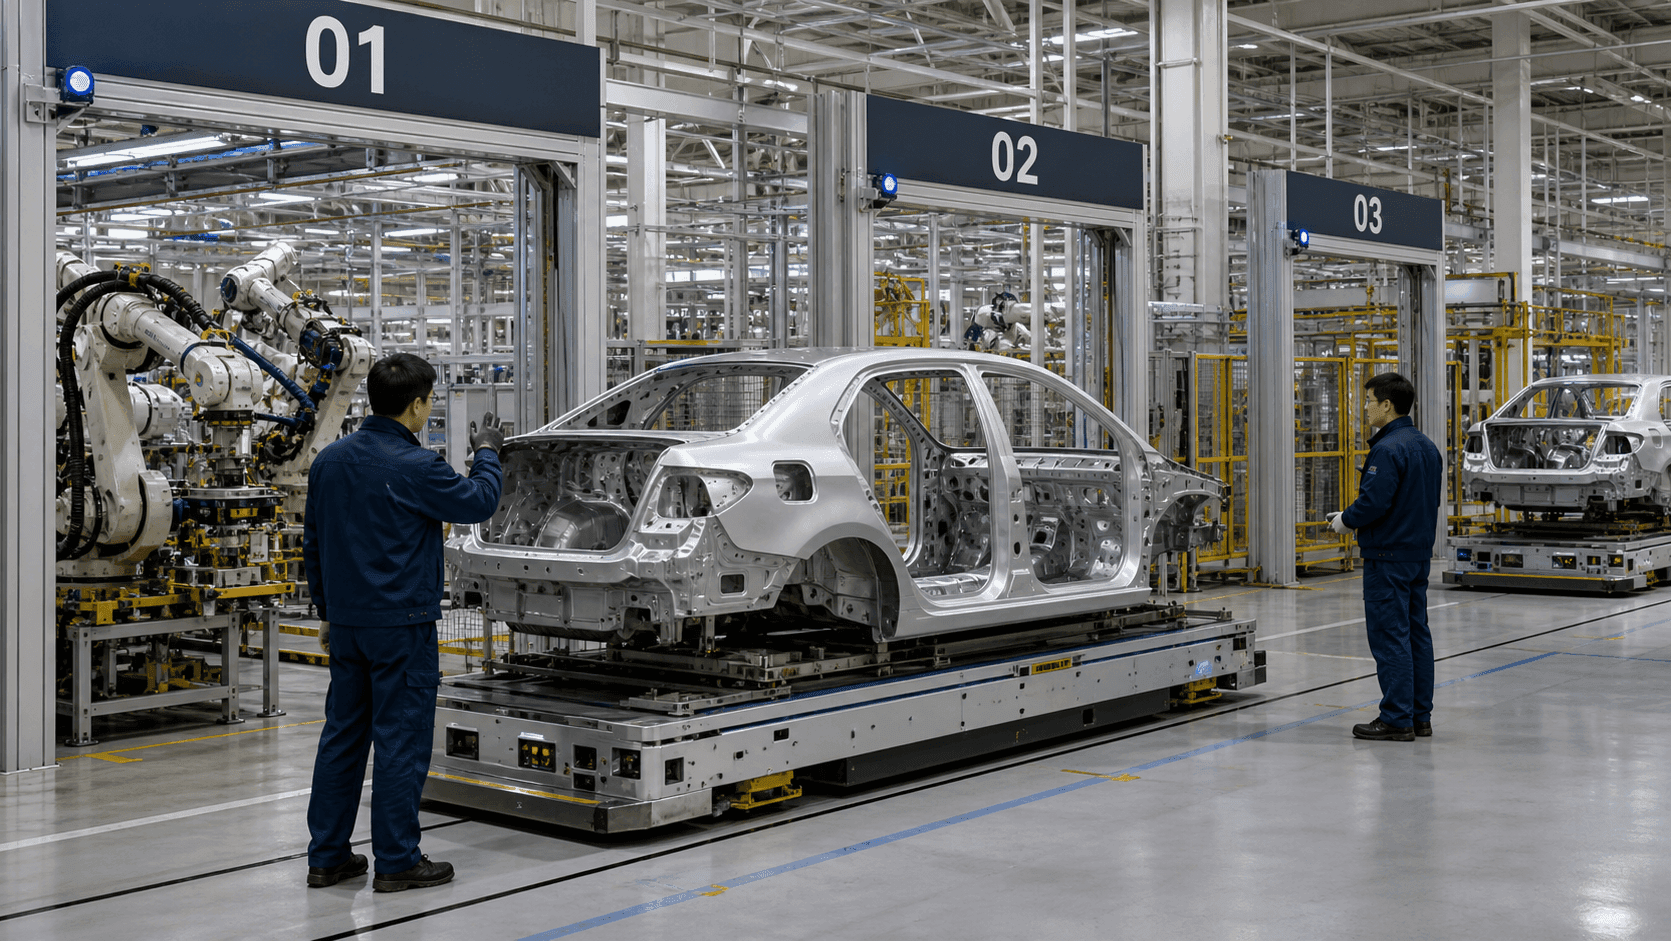
Looking up vehicle and work piece history
Look up the processes passed, the order of movement and dwell time by vehicle number or work piece identifier. When a quality problem or a late delivery comes up, the related production history is available quickly and the cause can be narrowed down.
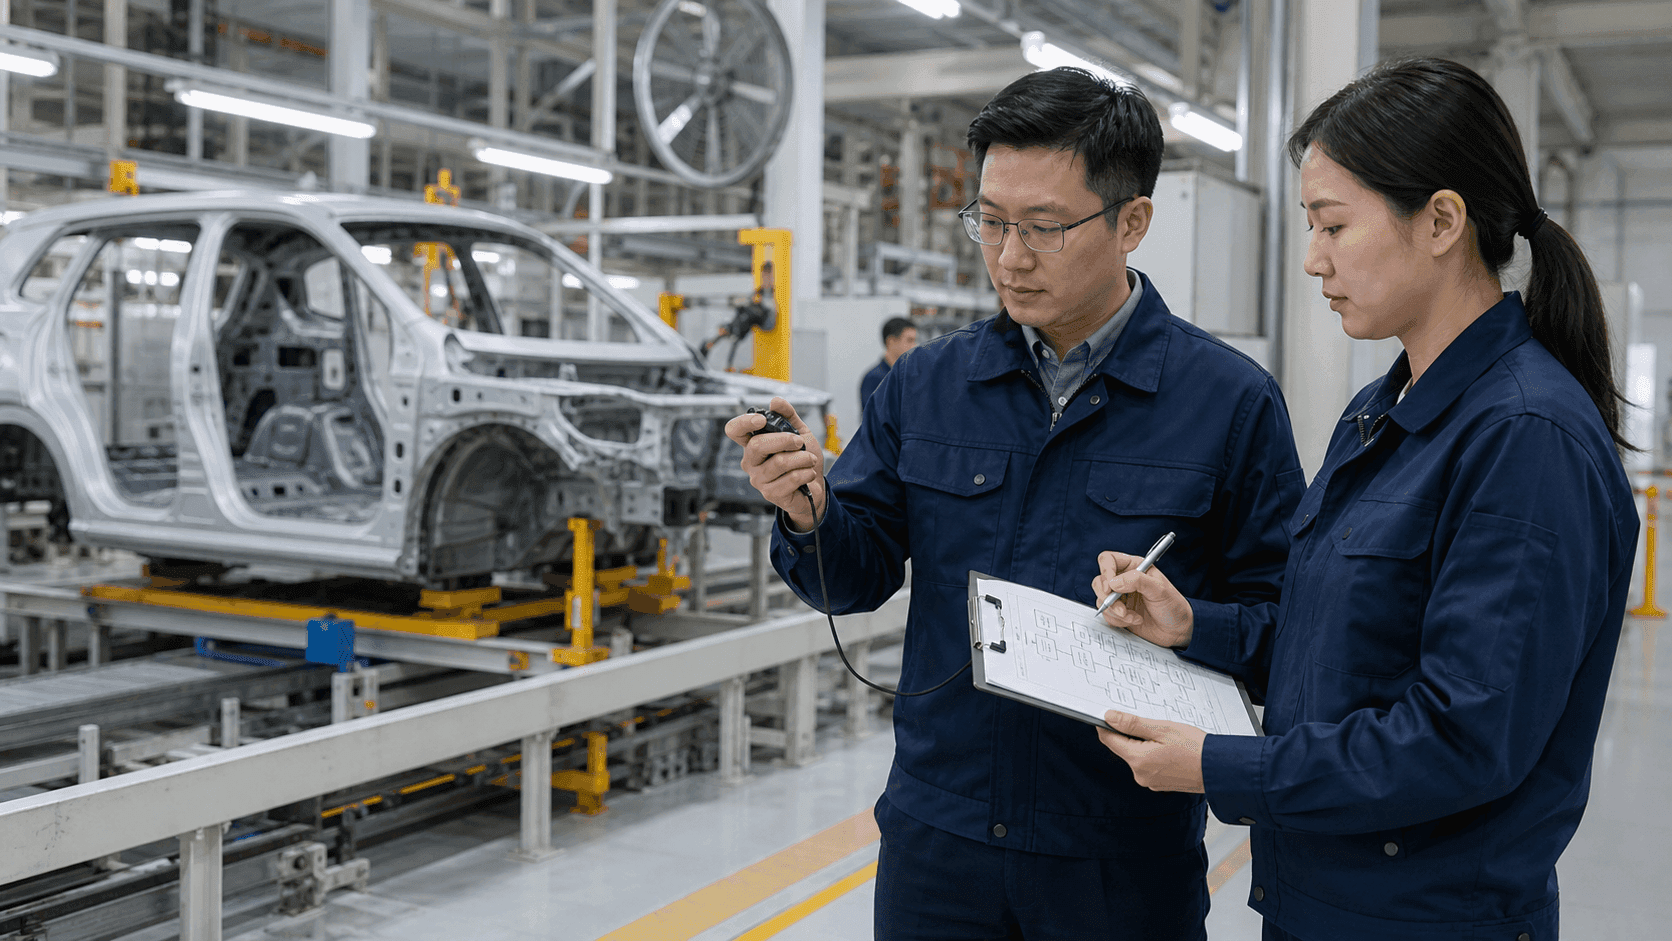
Verifying the effect before and after an improvement
After changing work sequence, movement routes or staffing, compare how much processing time and waiting quantity shifted. The effect of floor improvement work is verified against objective data and becomes the baseline for the next improvement task.
Recommended Products
Components Based on ORBRO OS
Each solution operates with various products connected on top of ORBRO OS. Configurations can be flexibly adjusted depending on the scope of application and on-site conditions.
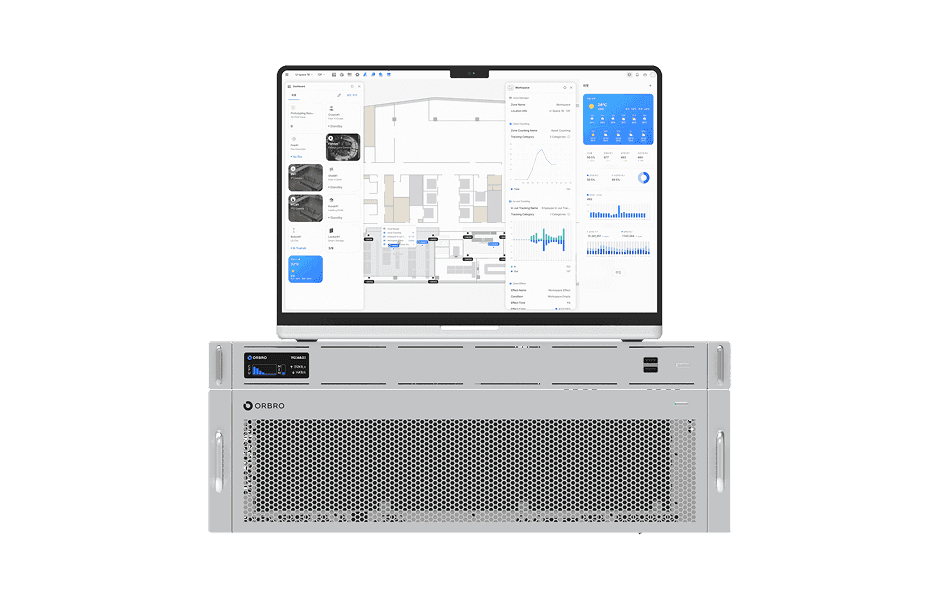
ORBRO OS2
ORBRO OS2
Align location, video, and sensor data on a spatial layer to turn all on-site situations into a single operational workflow.
Learn More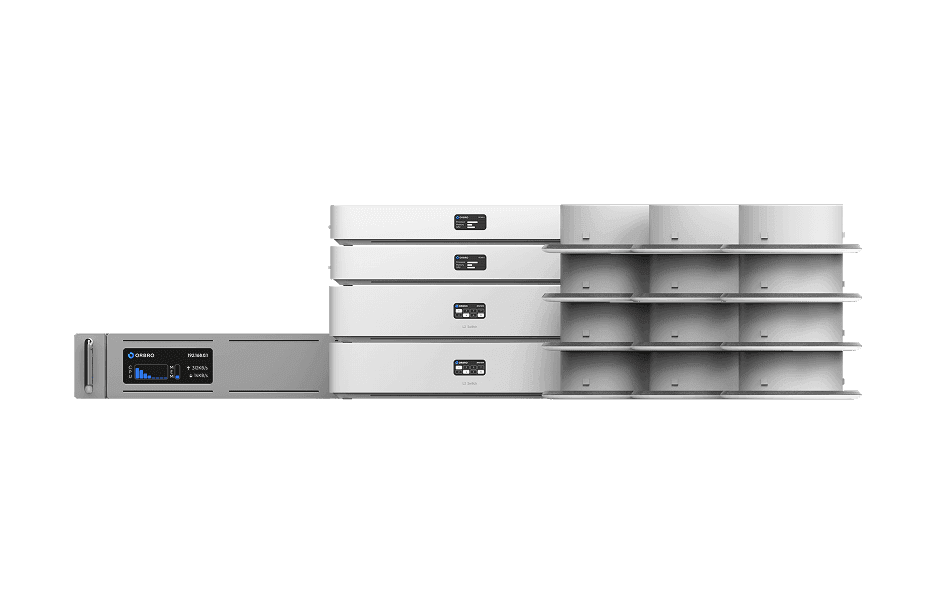
UWB Location Tracking
UWB Location Tracking
Enhance worker safety and precisely manage the movement of assets and equipment through real-time tracking, improving productivity and operational efficiency at the same time.
Learn More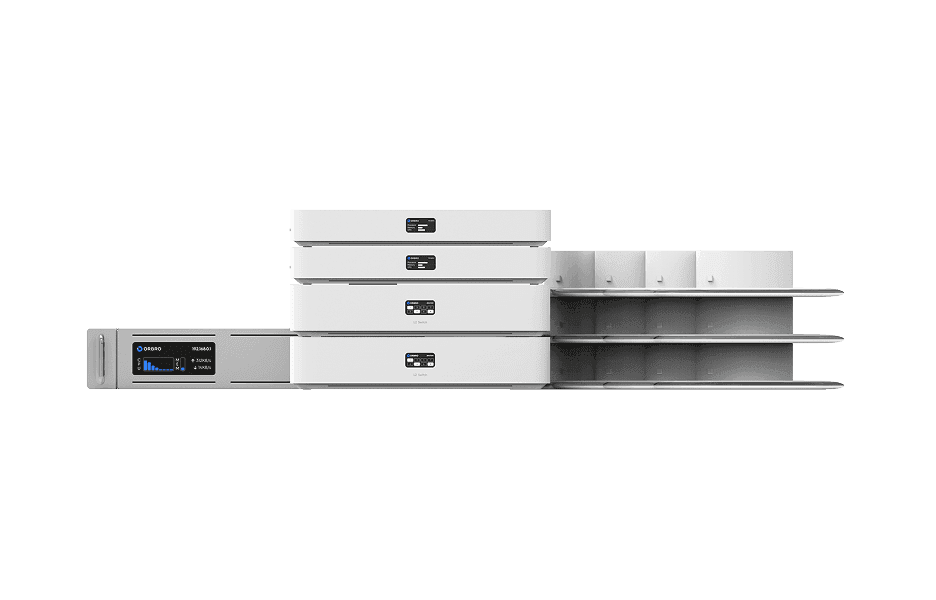
AoA Location Tracking
AoA Location Tracking
Beyond simple coordinates, this solution leverages signal angles to precisely identify movement direction and paths. It supports access control, enhanced security, and customer flow analysis as a next-generation RTLS solution.
Learn More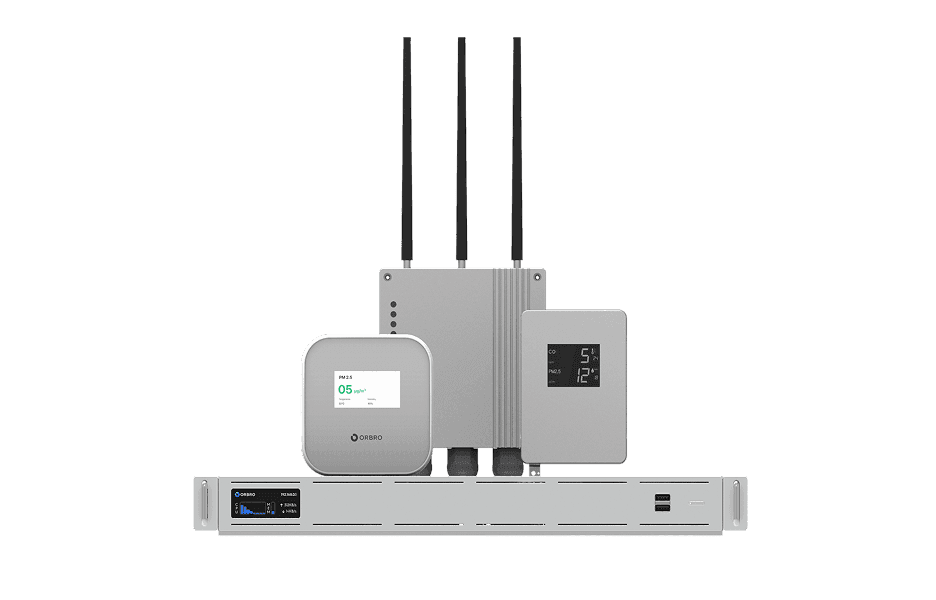
Sensor Monitoring
Sensor Monitoring
Provide a wide range of monitoring solutions required on site, from LoRa communication sensors to CO₂ detectors and air quality monitors.
Learn More