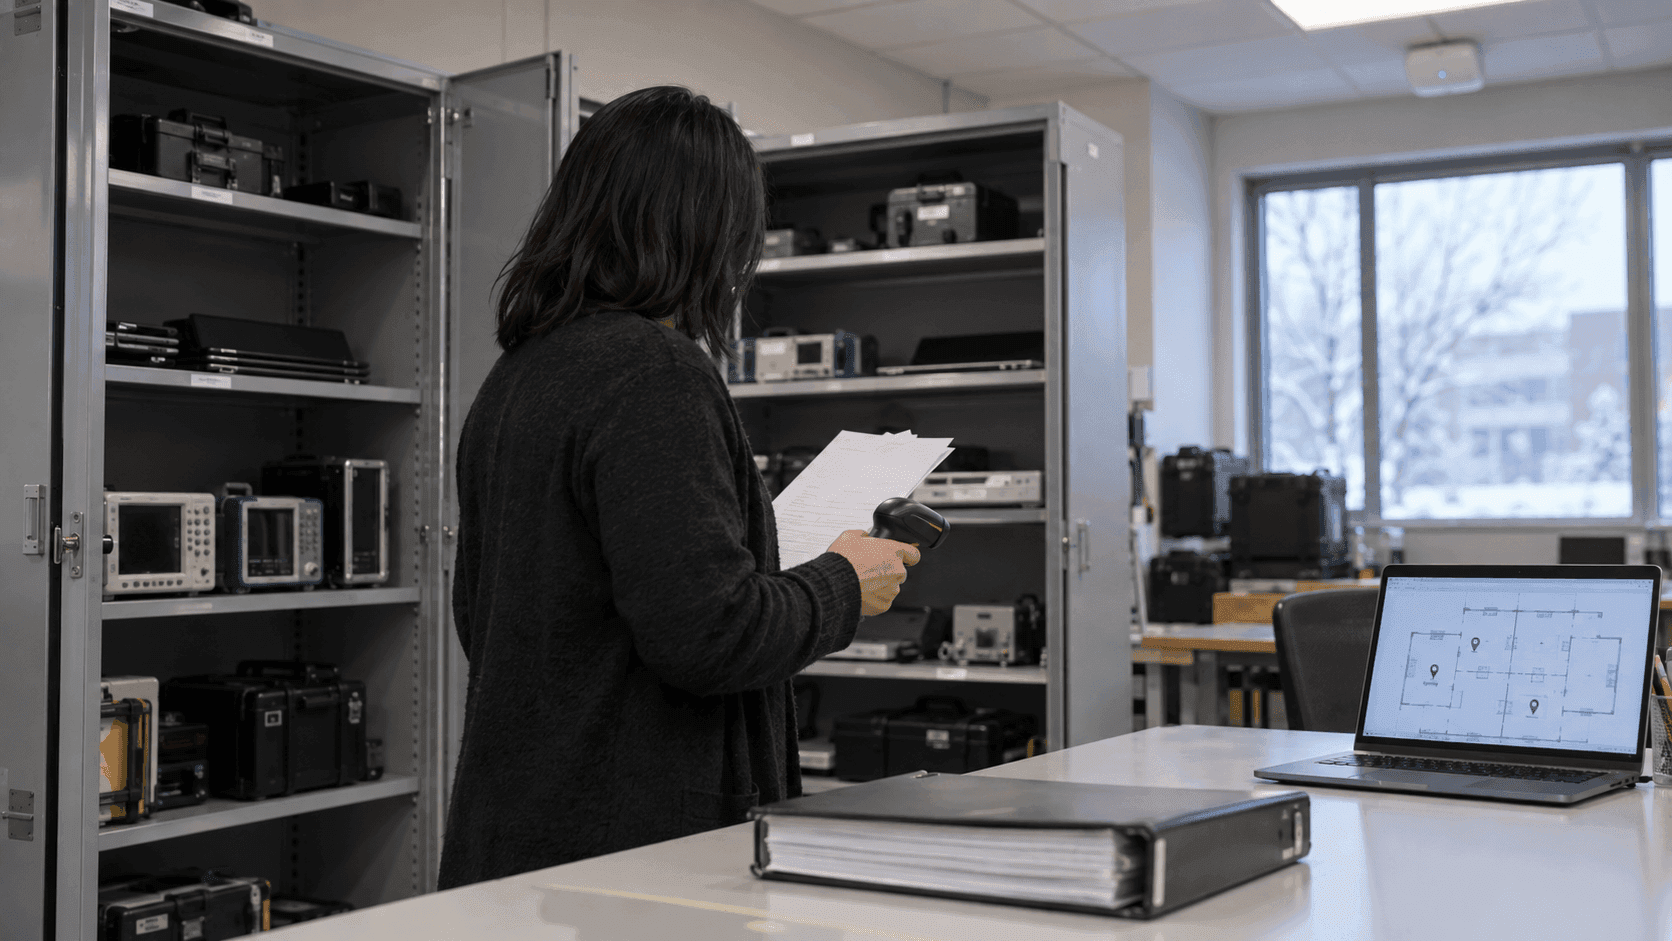
Smart City Solution
Urban Infrastructure Digital Twin
Save the cost of building a new 3D model and use the data the agency already holds as it is. What is newly built is limited to building interiors, so the scope of work is clear.

Connect indoor maps and real-time operating data to the city 3D model
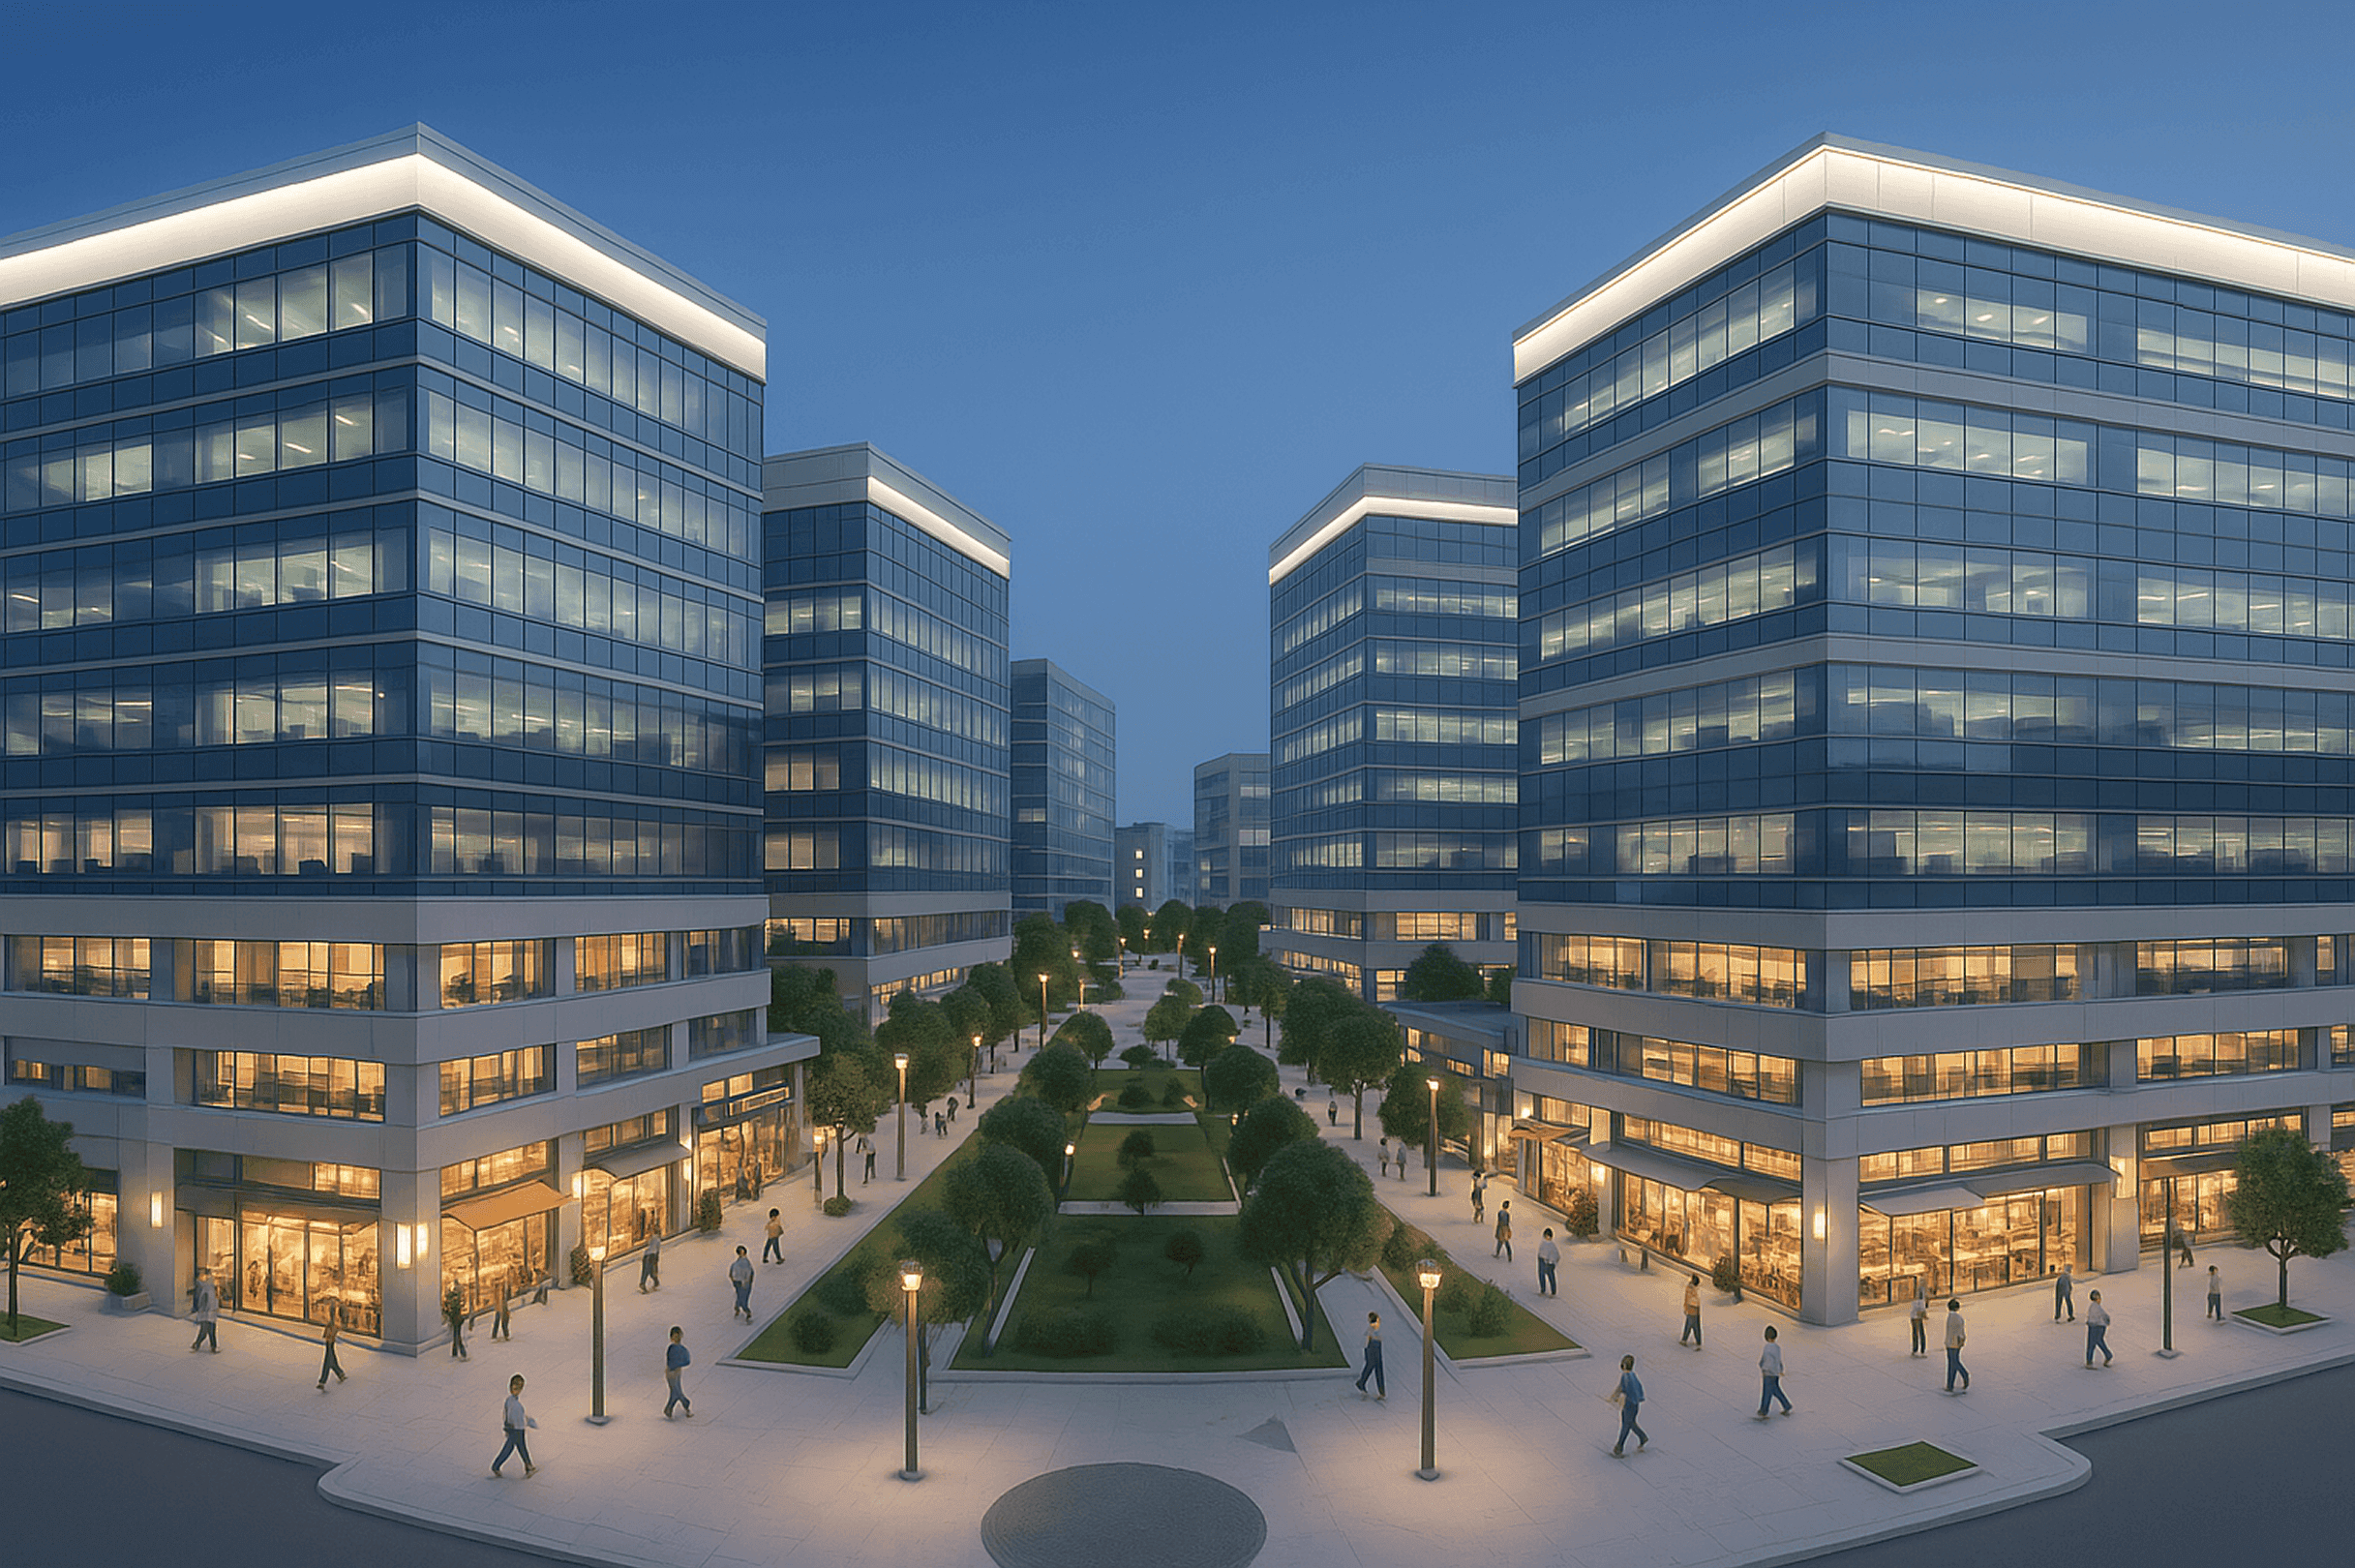
ORBRO Server loads the 3D spatial data built by national bodies and local governments as it is and uses it as the base map. Data received from each department and agency system is placed on that map in real time. Structures with stacked floors are provided both as a per-floor view and as a whole-building view.
ORBRO Server
The layer that reuses 3D spatial data already built and places live data on top of it by coordinate. It pulls data by API from the systems of each department and outside agency and aligns it by location, so there is no need to rebuild the 3D model or remove the monitoring system already in use. A closed network configuration installed on a server inside the government building is also supported.









Real-Time Integration with Existing 3D Models
The spatial data already built is used as it is, and the only addition is a layer that places live data on it by coordinate. Because no new model is created, the build cost and schedule shrink accordingly.
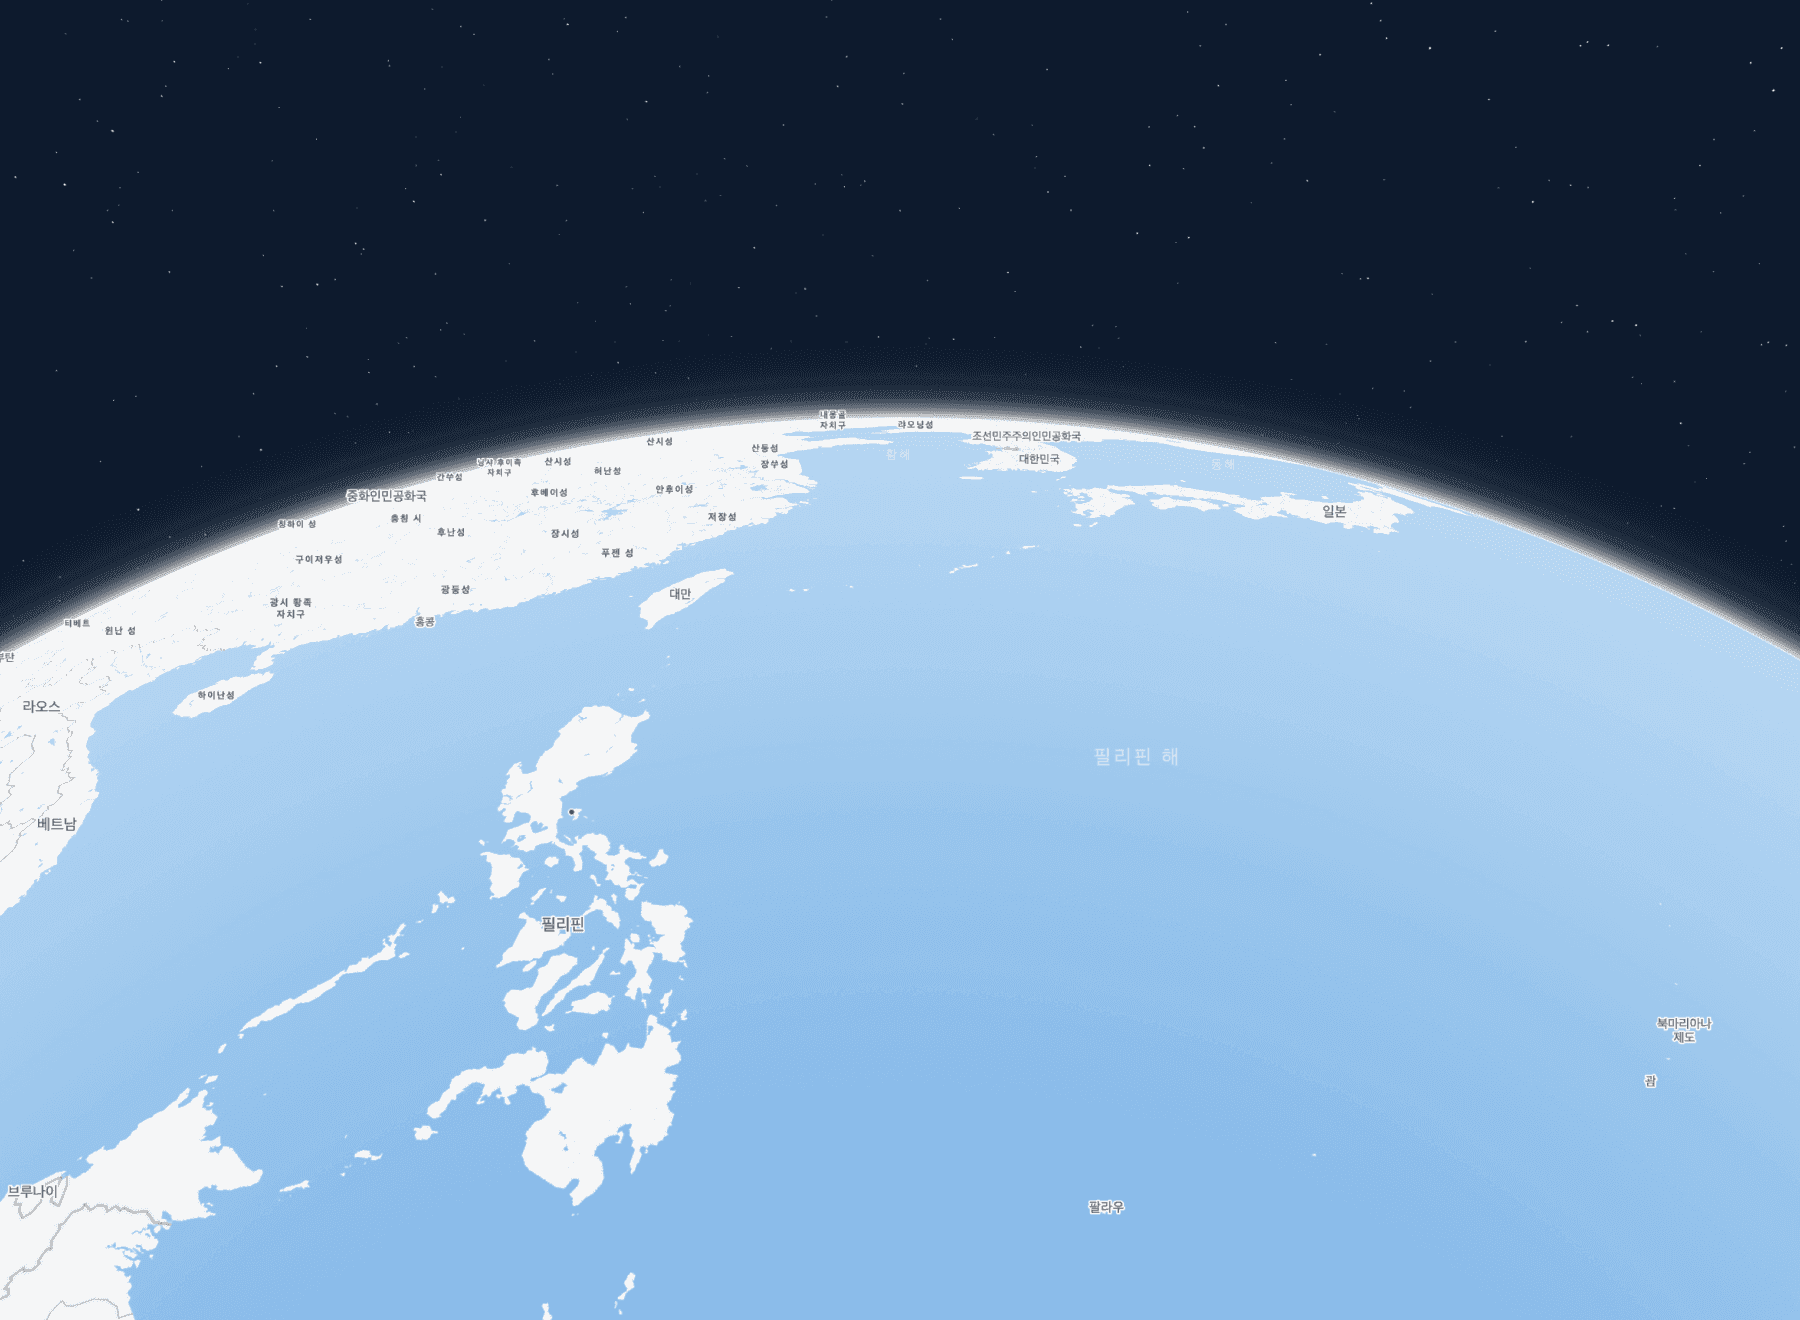
3D spatial data displayed in real time
The 3D spatial data already built by national bodies and local governments is taken and used as it is. Data from each system is placed on top of it by coordinate, so no cost or schedule goes into building a new model. New kinds of data align on the same coordinates, so they show up without rebuilding the screen.
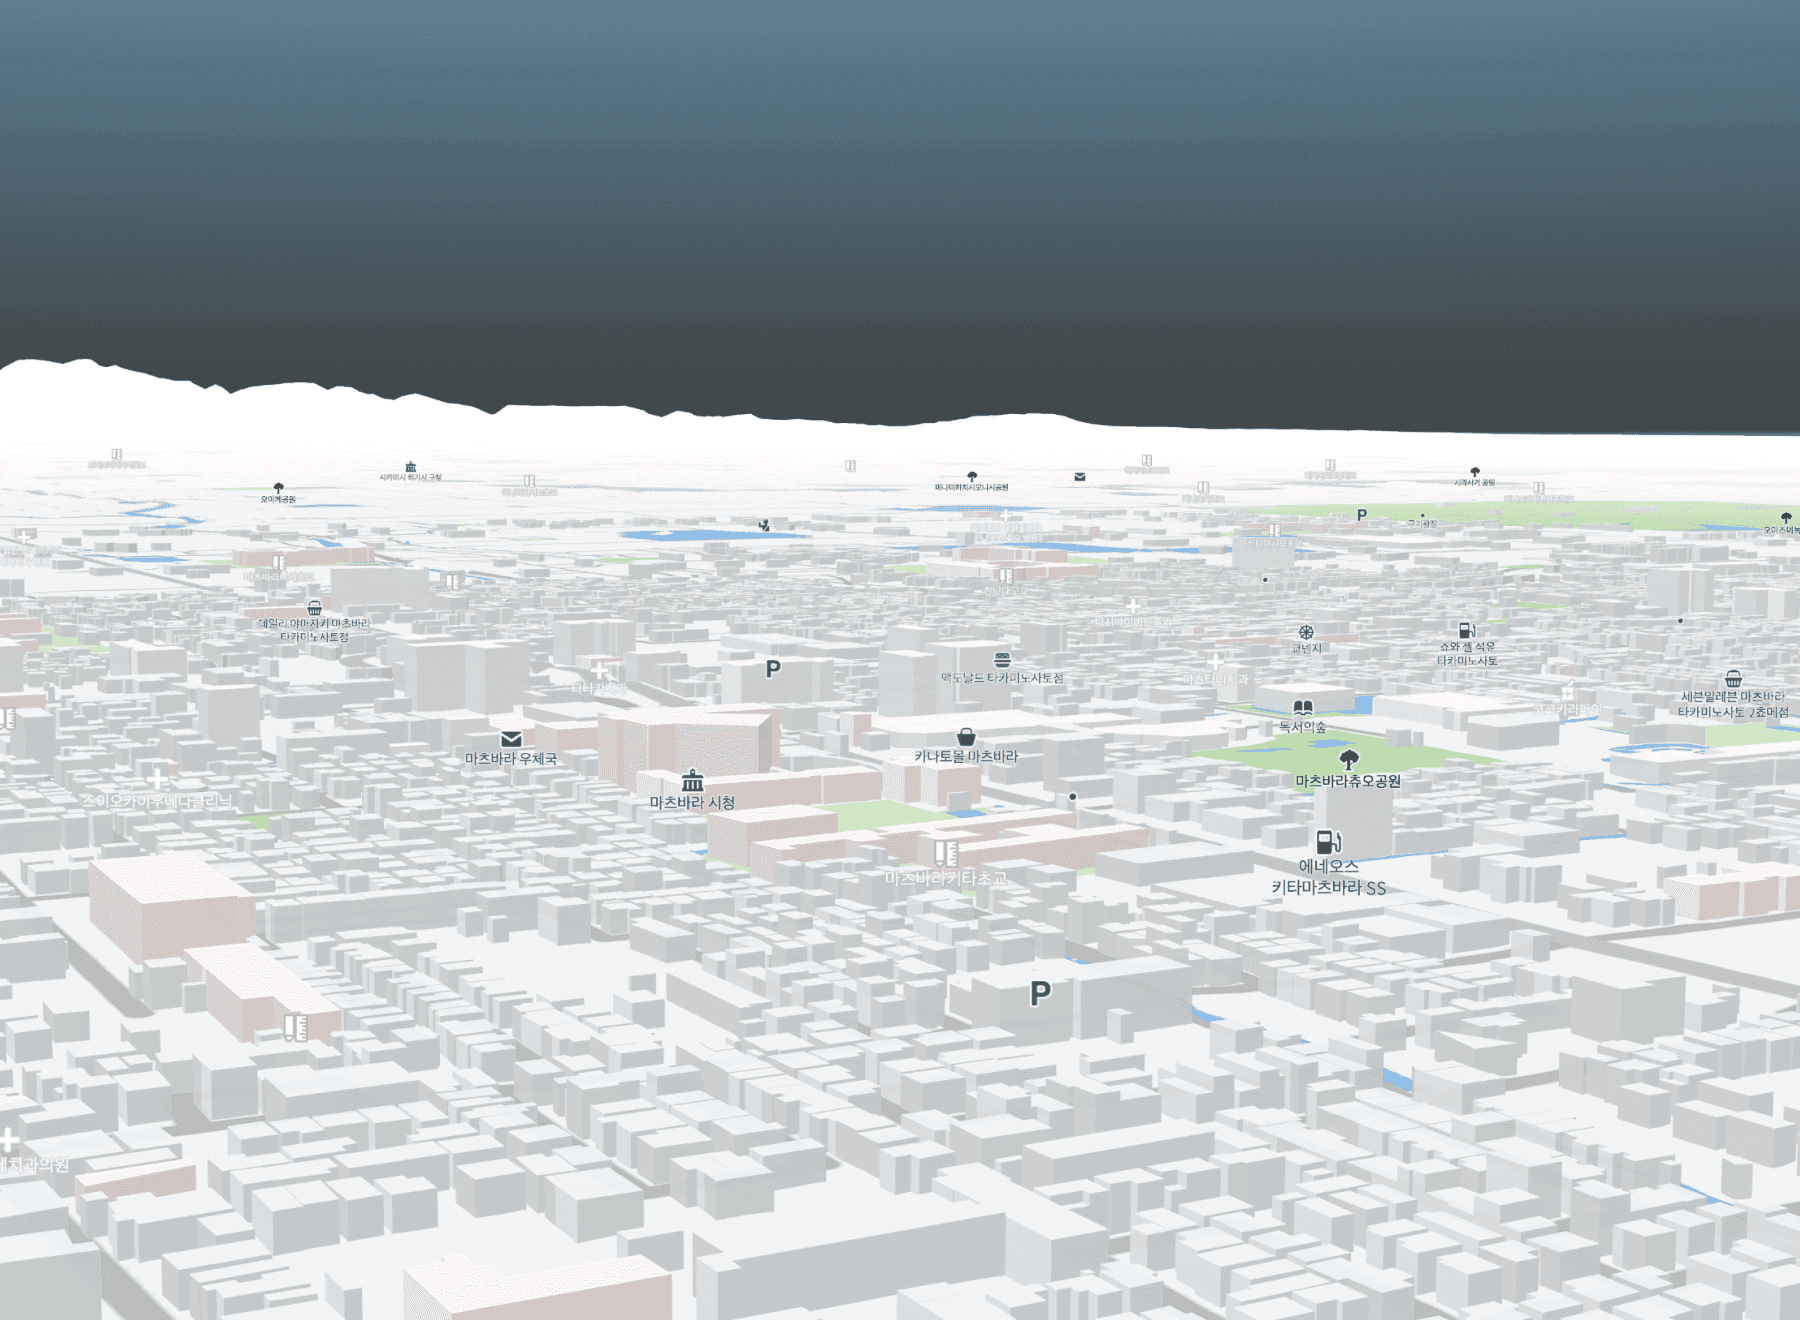
Air quality and weather data connected in real time
The control room server takes data from the Korea Meteorological Administration and overlays temperature and air quality on the 3D city model. You see which zone holds the bad value directly in space, which speeds up the choice of where to respond. The regions shown and the refresh interval are set to match the observation points the client already uses.
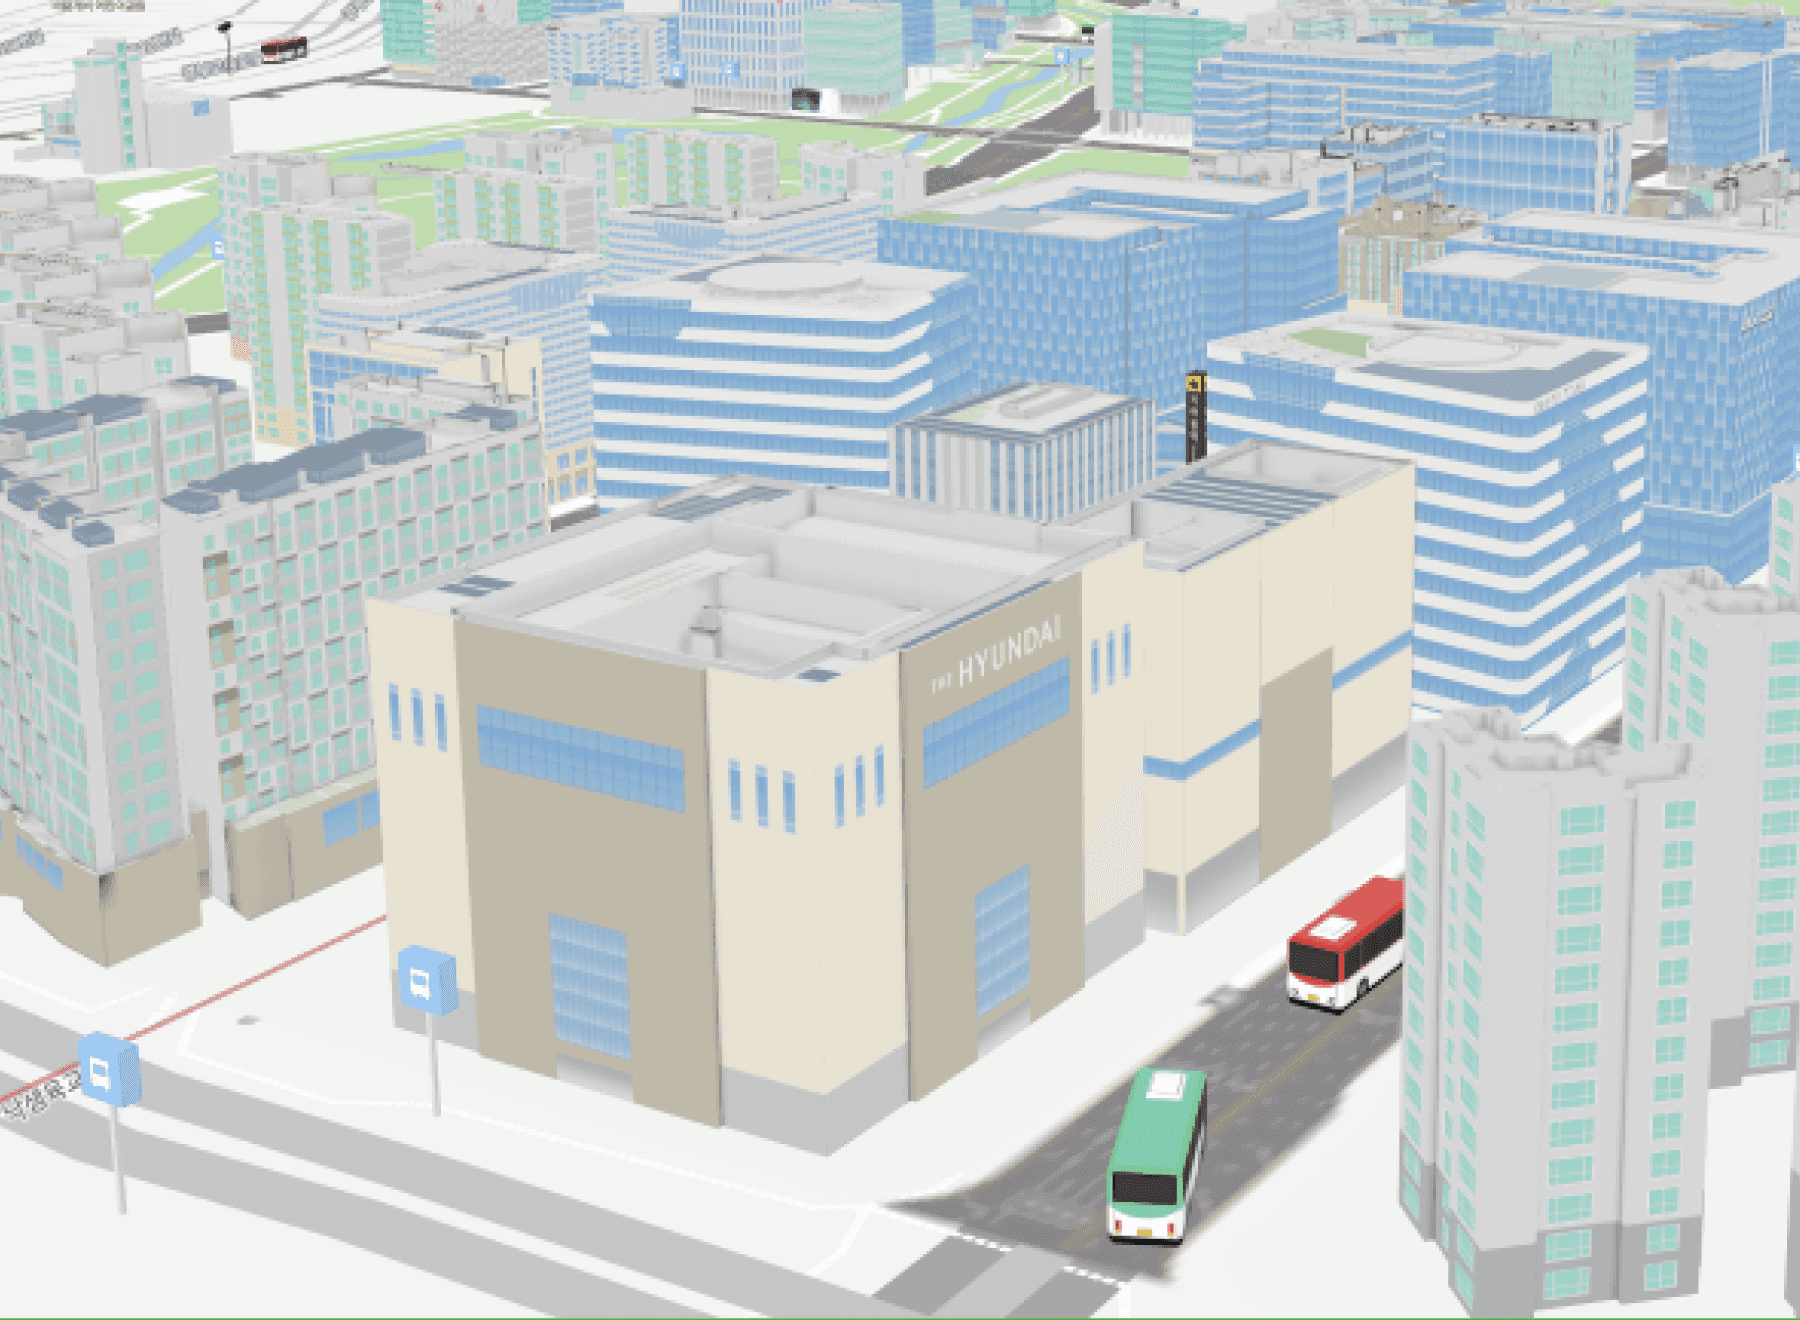
Building information and occupancy by zone
How many people are in each building right now and which zone they are concentrated in is counted as a headcount only and placed on the 3D model. Only the numbers per zone are kept, with individuals and their paths left out, so it applies in spaces the public uses. Comparing usage across times of day reveals which zones fill up at which hours.
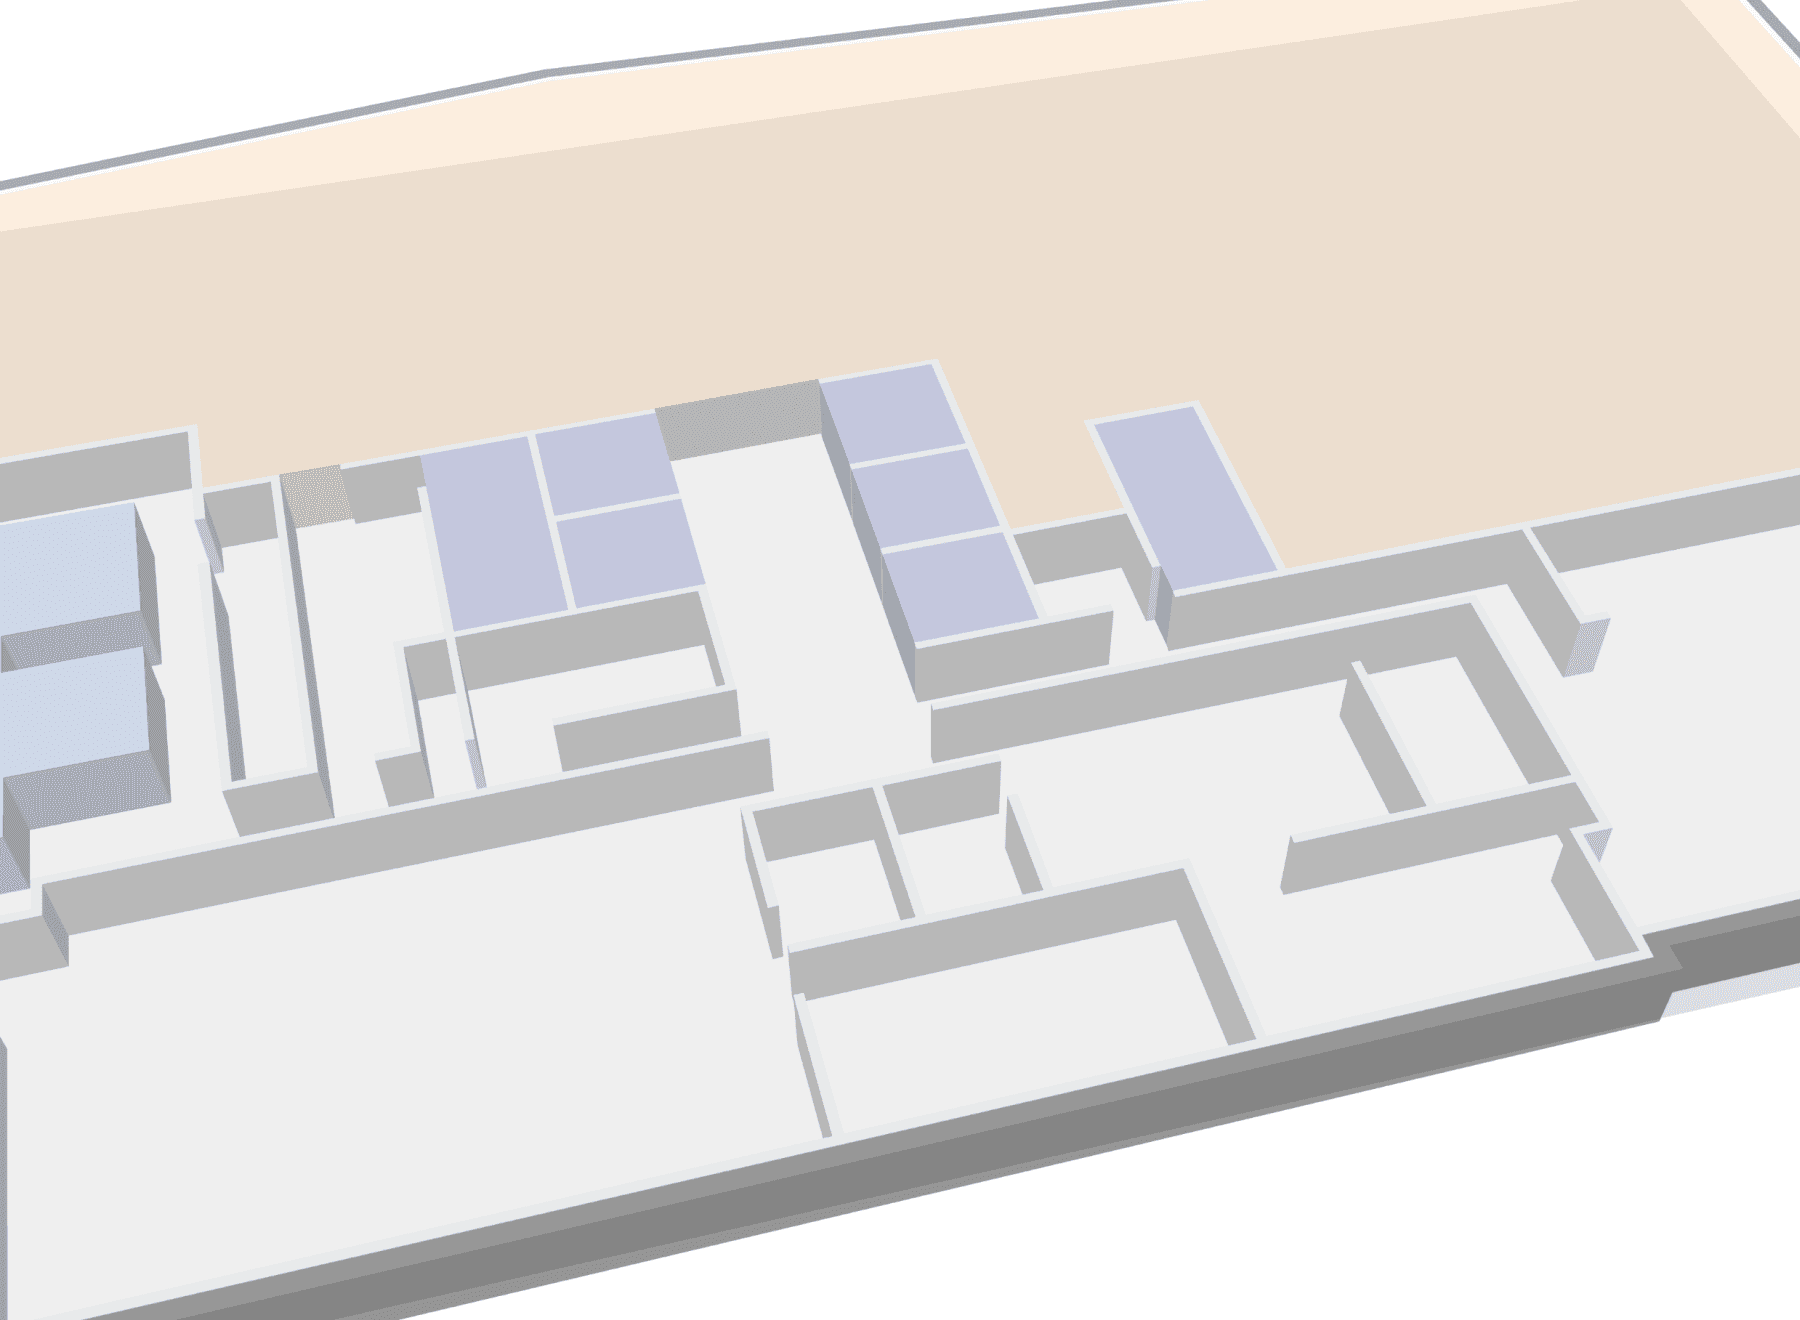
Indoor maps and detection of procedure deviations
A 3D city model draws buildings as exteriors only. Building indoor maps from the floor plan of each level and connecting indoor location brings the building interiors, empty until now, onto the screen. Someone entering a restricted zone or skipping a step in a fixed sequence is detected and kept as an event, with the person who checked it and the action taken recorded alongside.
Indoor Building Map Integration
Weather, traffic and video are connected from the data each agency provides and laid out on the same screen. What is newly built is limited to the indoor maps and location data inside the buildings.
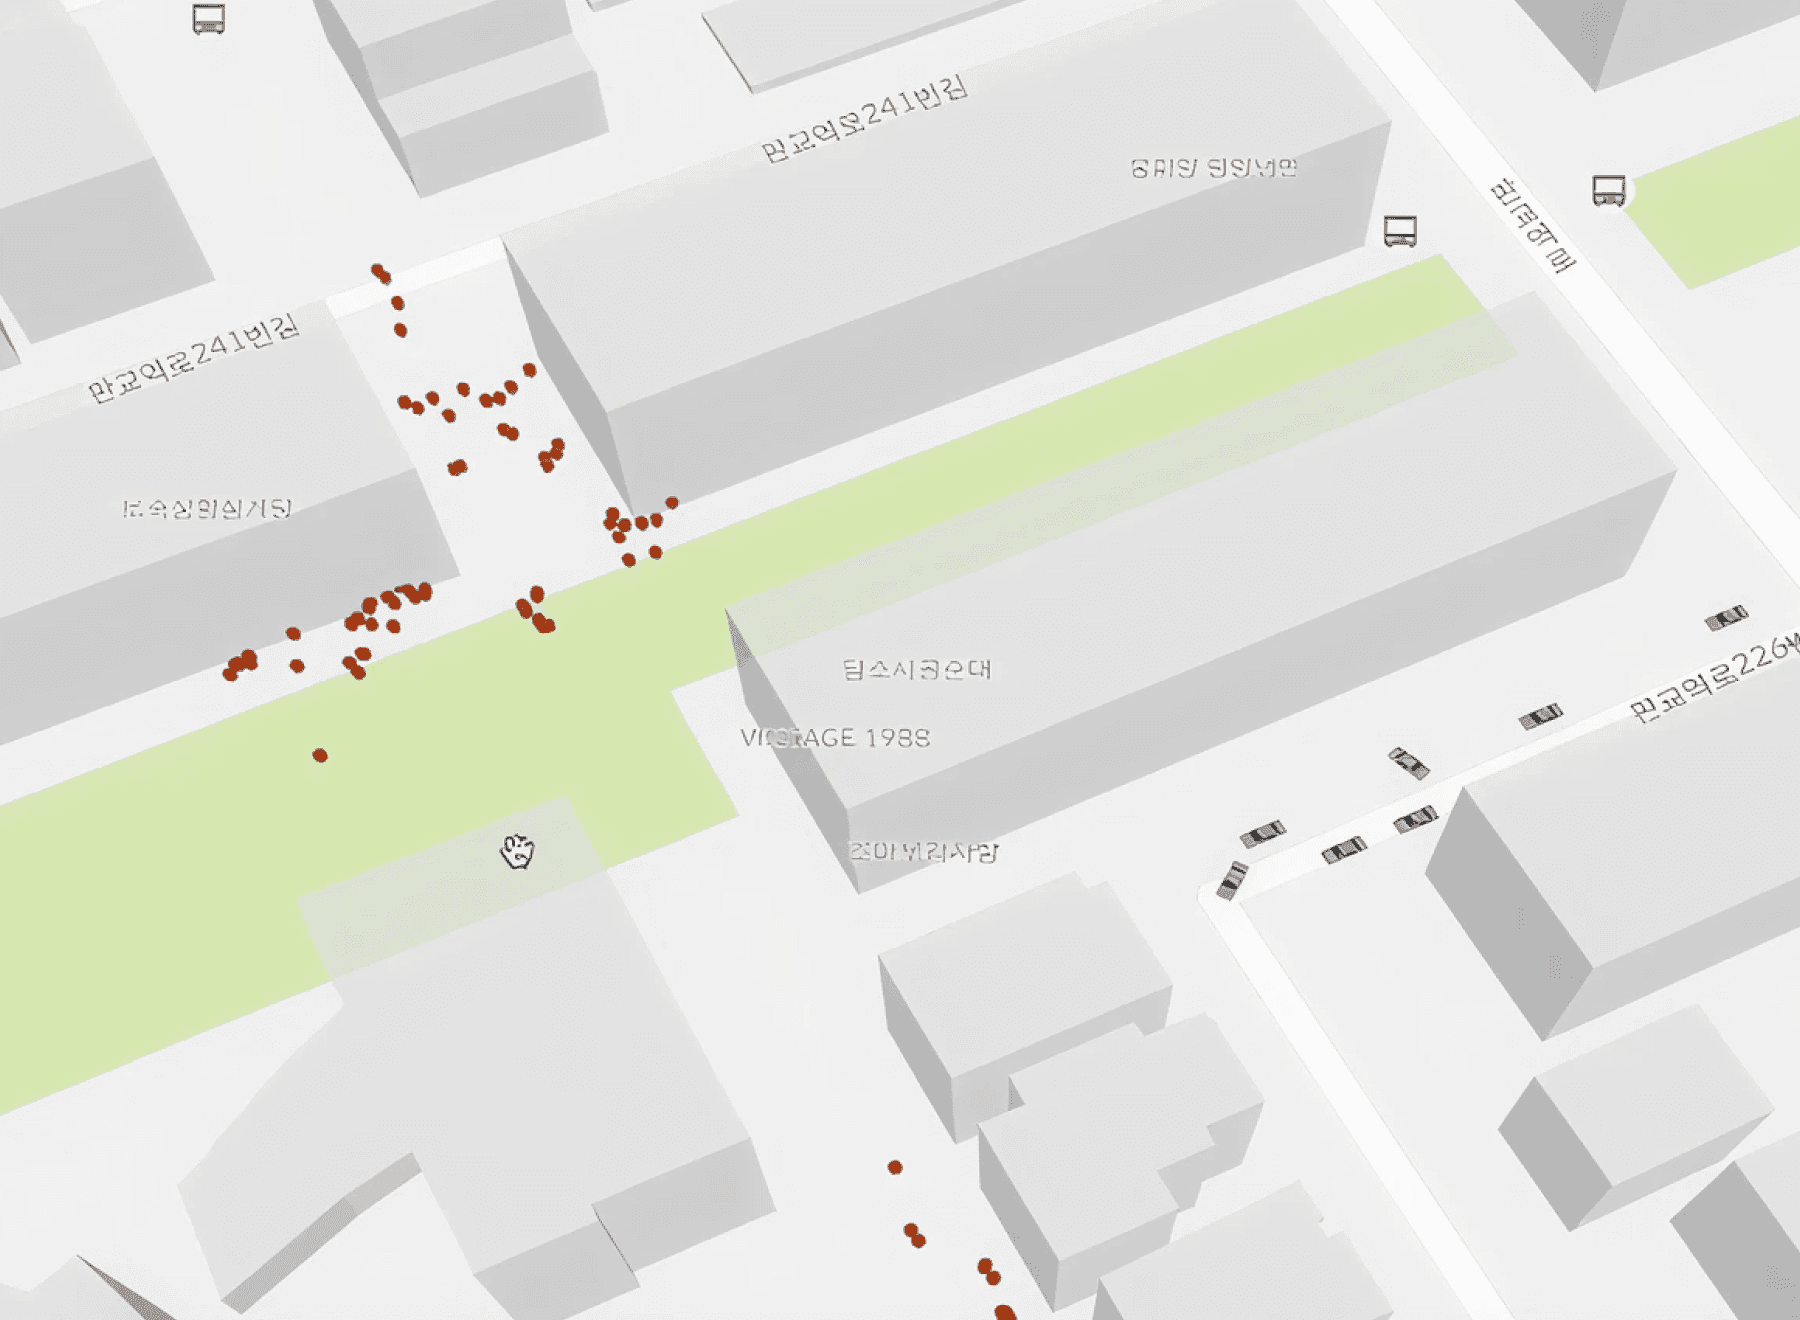
Managing people and vehicle movement data
See on the map which zones around a facility people and vehicles move through. Movement of people and vehicles in and out of the facility is counted by zone and placed on the same 3D view. The scope of integration with each owning department's system is agreed before the project starts.
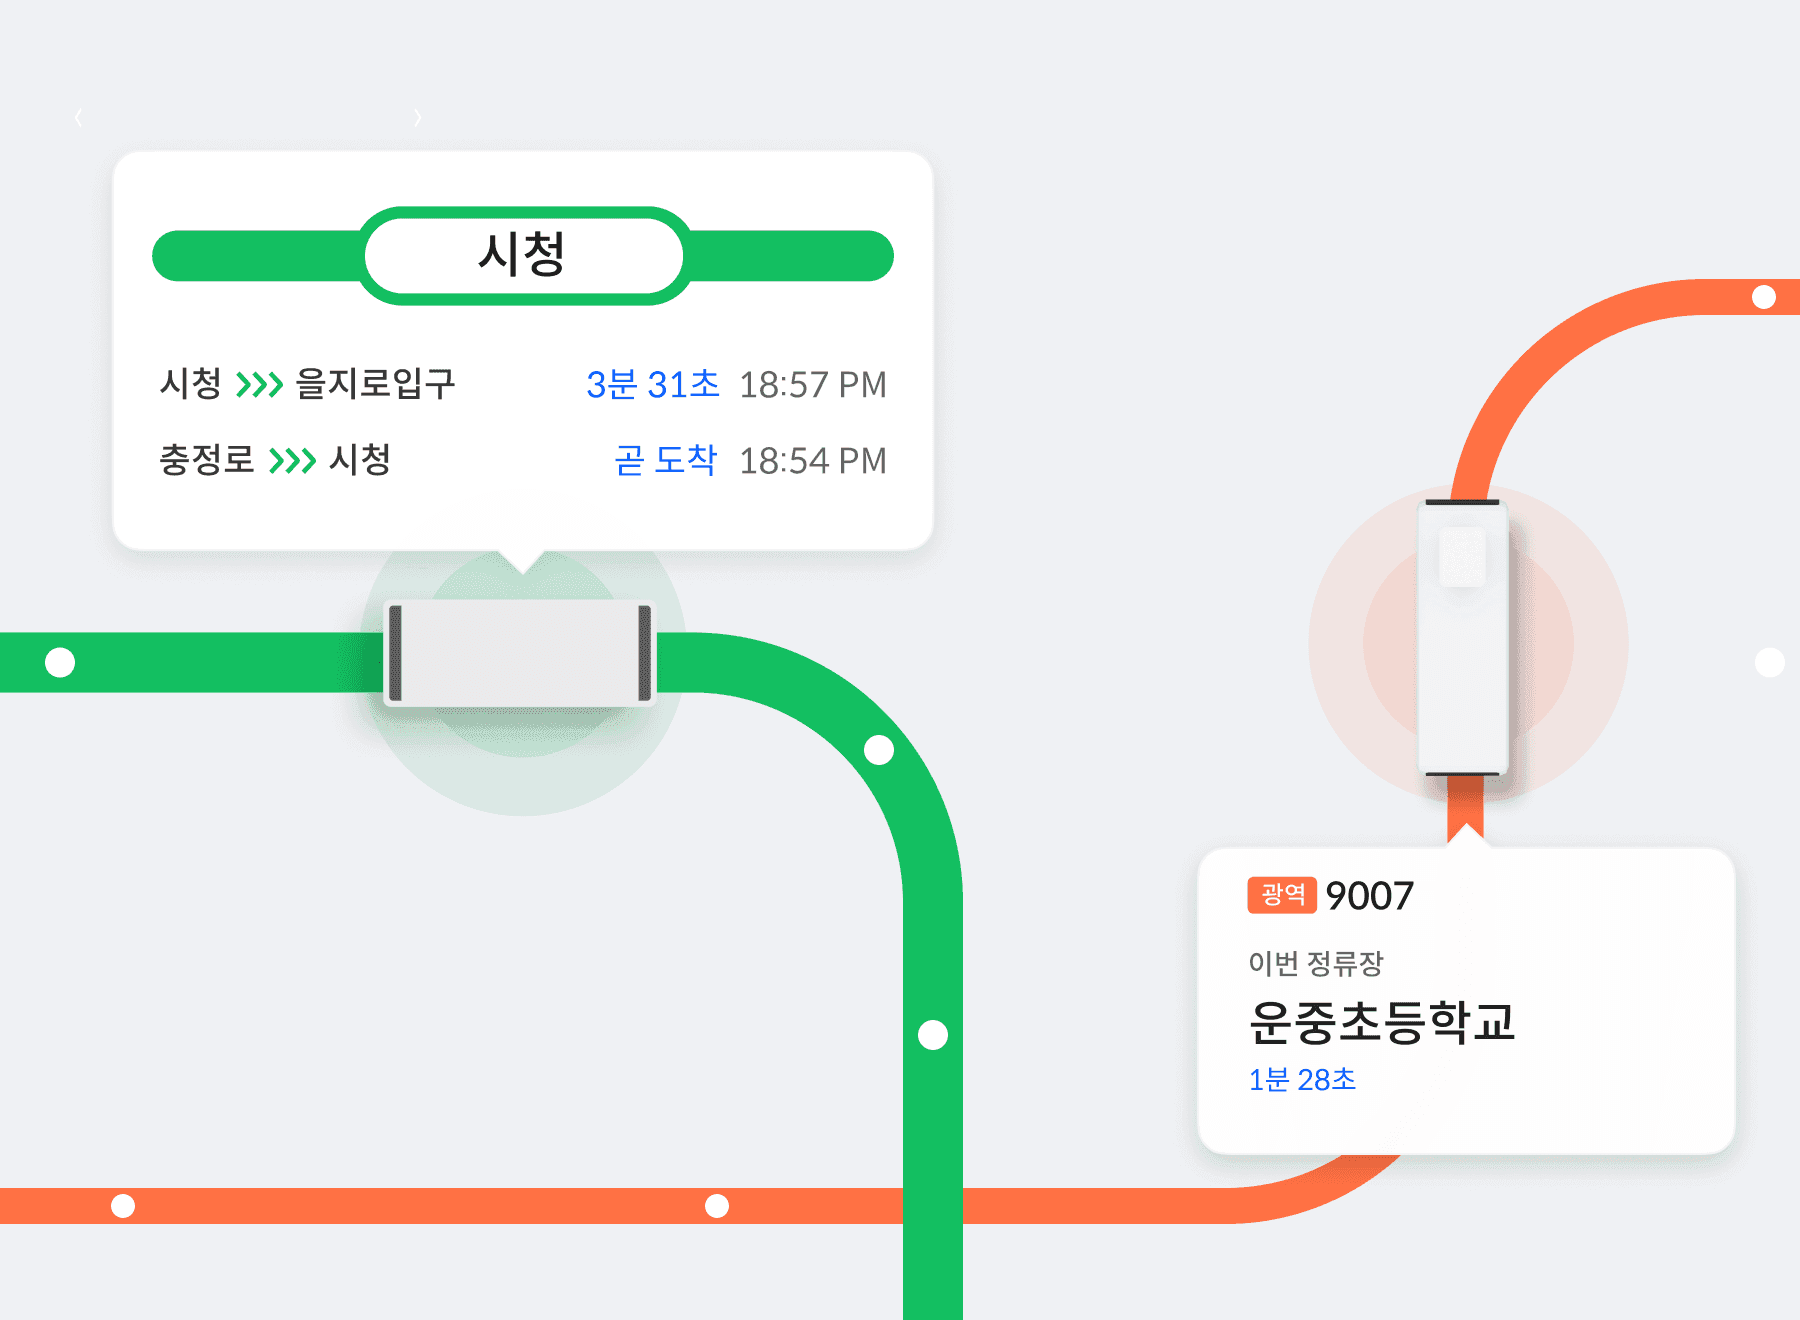
Public transit service data connected
Data each agency publishes, such as bus and subway service information, is laid out on the same screen. Creating the data and its accuracy belong to the providing agency, and ORBRO takes the role of aligning it on one screen. What can be connected varies with each agency's disclosure policy, so the target list is fixed before work begins.
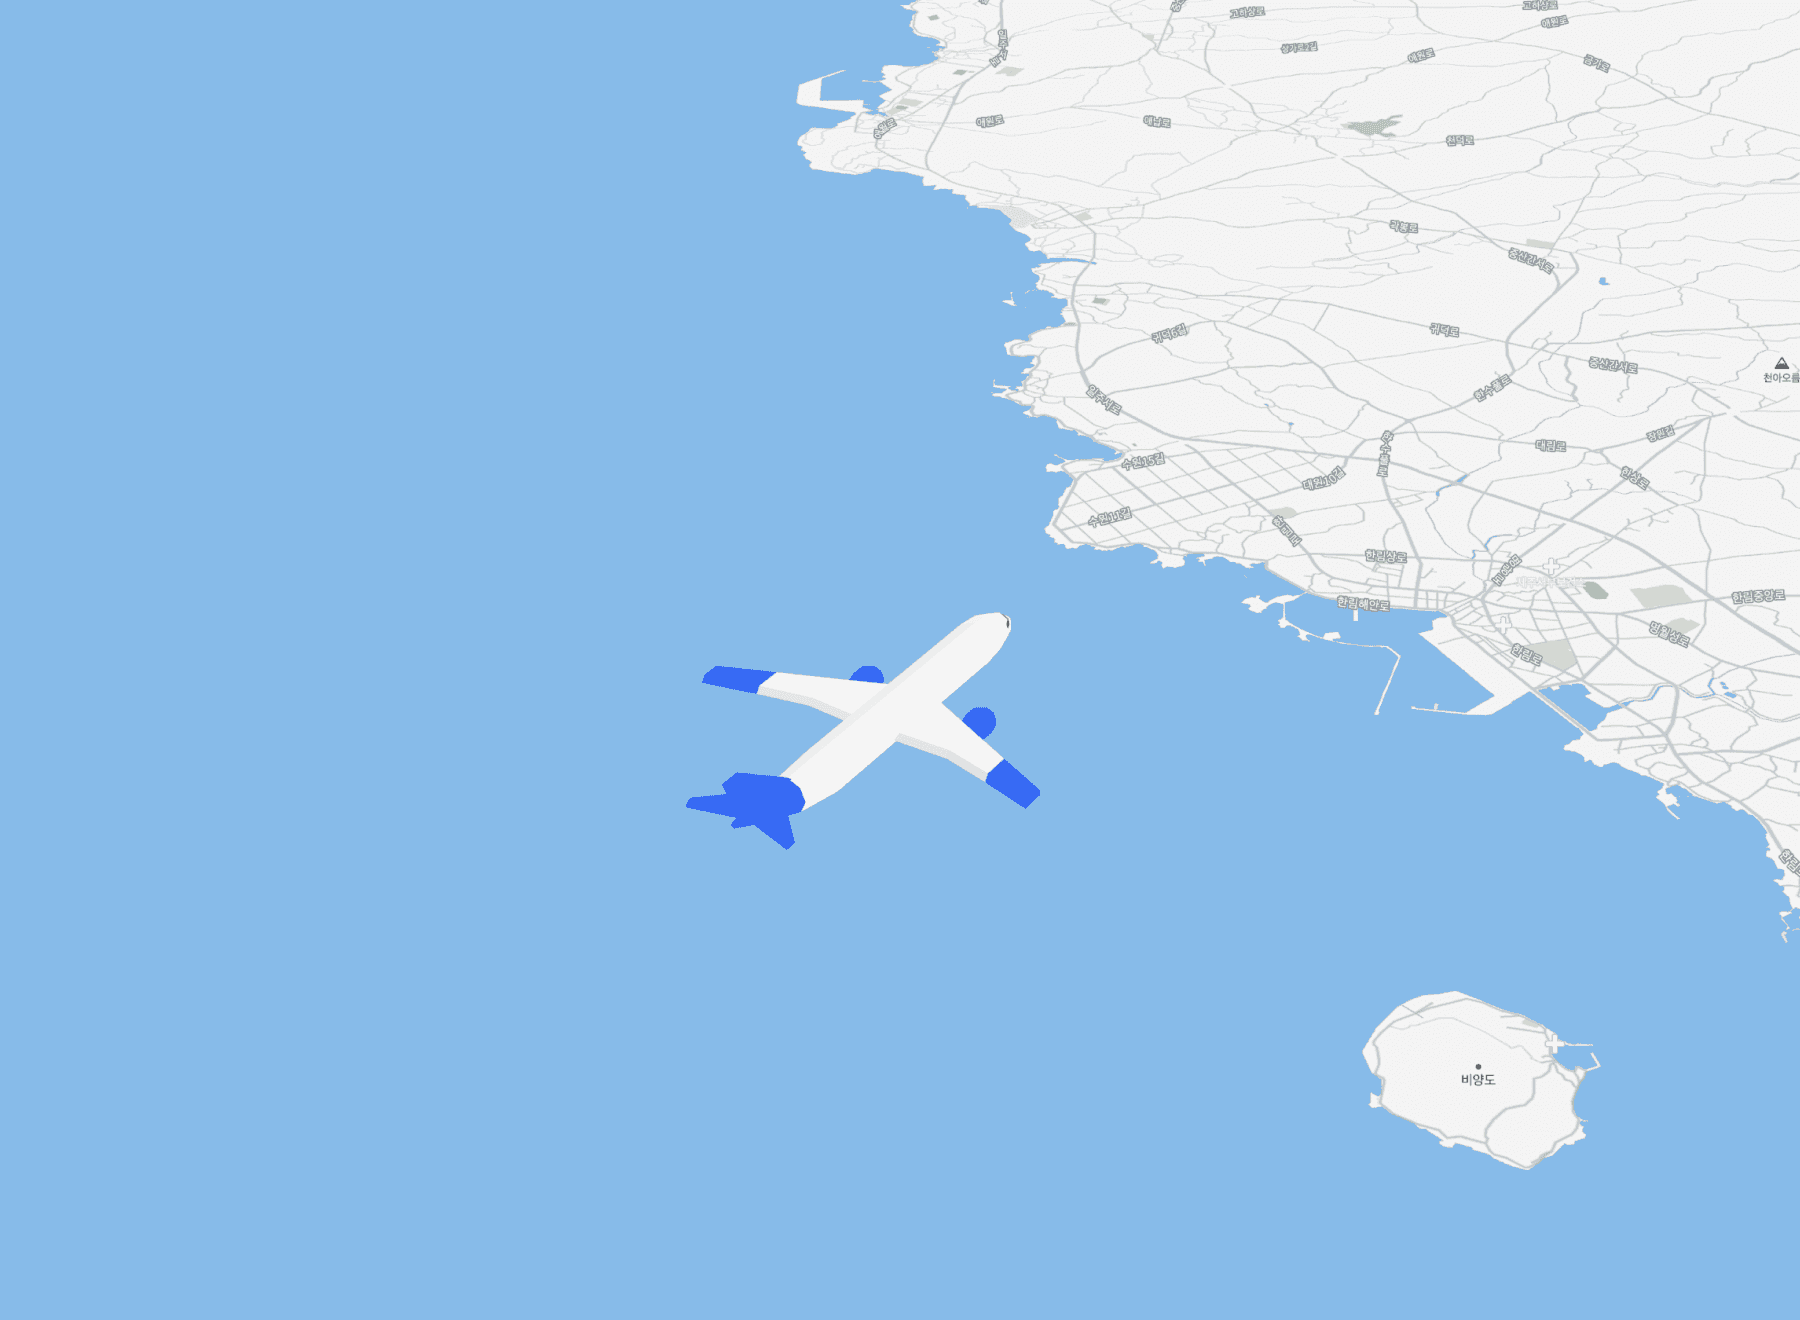
Aviation and regional mobility data connected
For a local government with an airport, put flight operations on the same screen as well. Data is received in whatever format each agency publishes and aligned to the same coordinate system, and items with a narrow provision scope are shown alongside a substitute indicator. The list of what gets connected is narrowed down by the agreement reached with each agency.
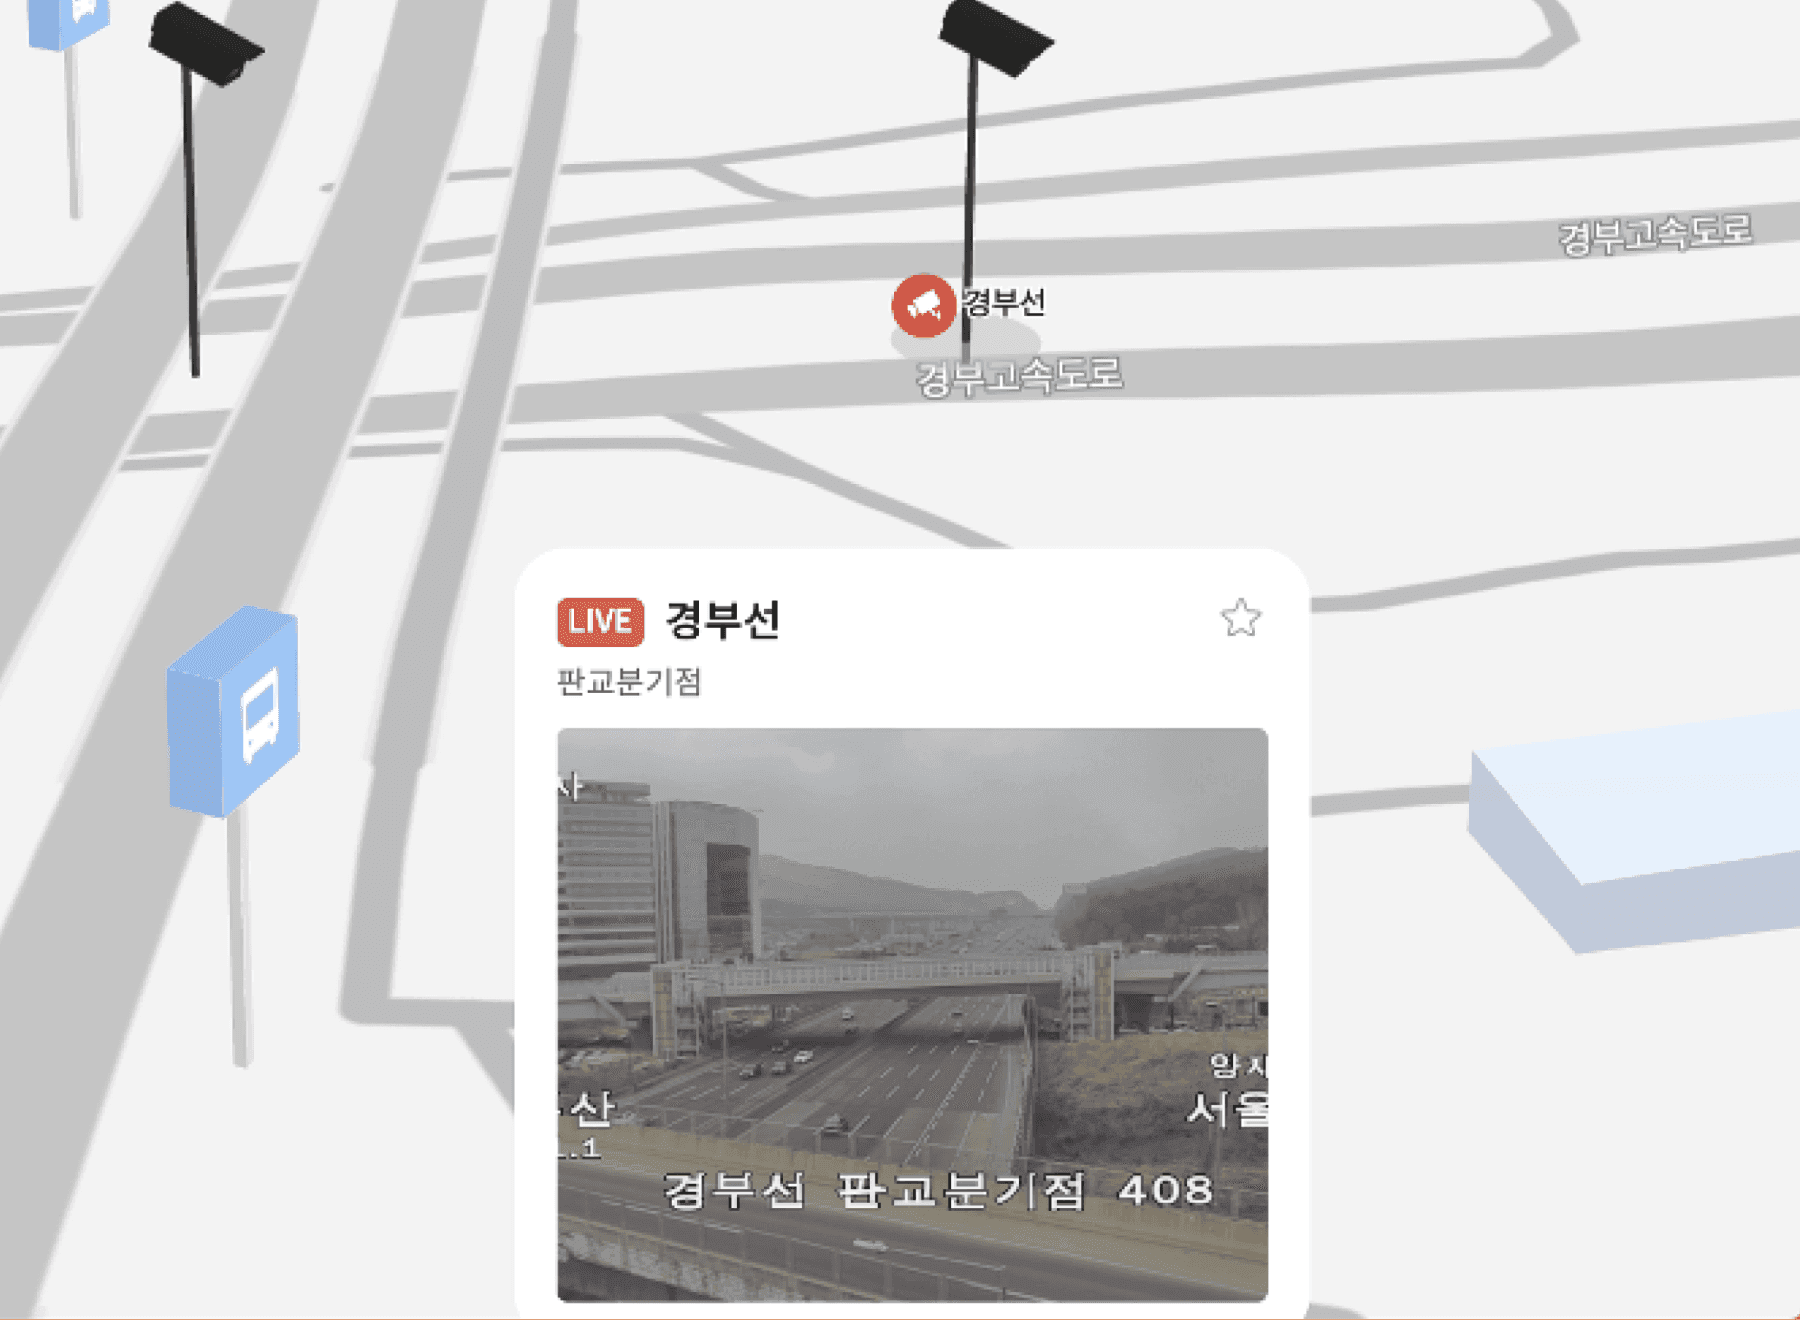
Integrated CCTV display and monitoring
ORBRO Server lays out video from the existing control center on the same screen and links it to location data so the video for a given point opens immediately. Because several people watch the same screen, the layout is adjusted to the way the agency operates. Split screen layouts are saved and recalled as the situation requires.
Recommended Products
Components Based on ORBRO OS
Each solution operates with various products connected on top of ORBRO OS. Configurations can be flexibly adjusted depending on the scope of application and on-site conditions.
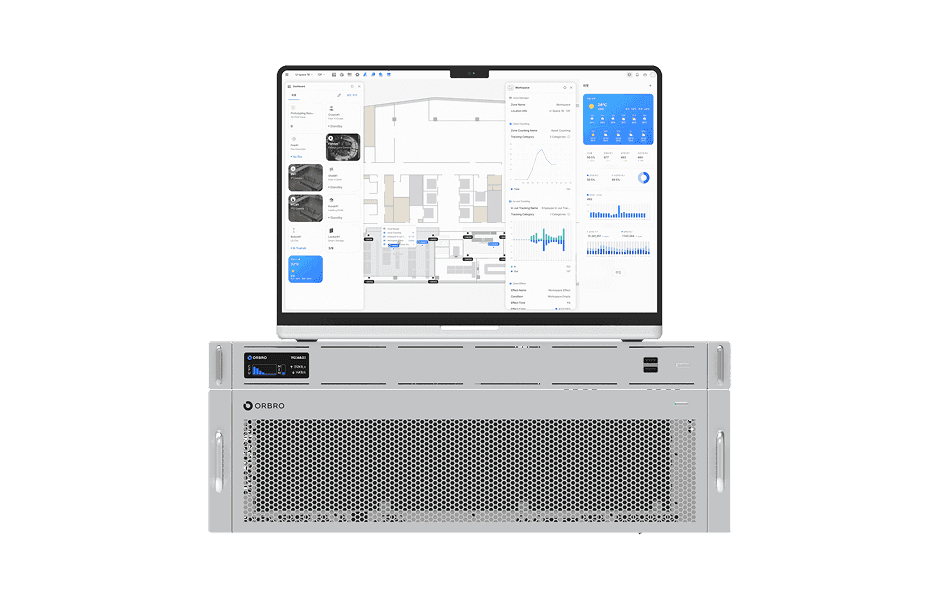
ORBRO OS2
ORBRO OS2
Align location, video, and sensor data on a spatial layer to turn all on-site situations into a single operational workflow.
Learn More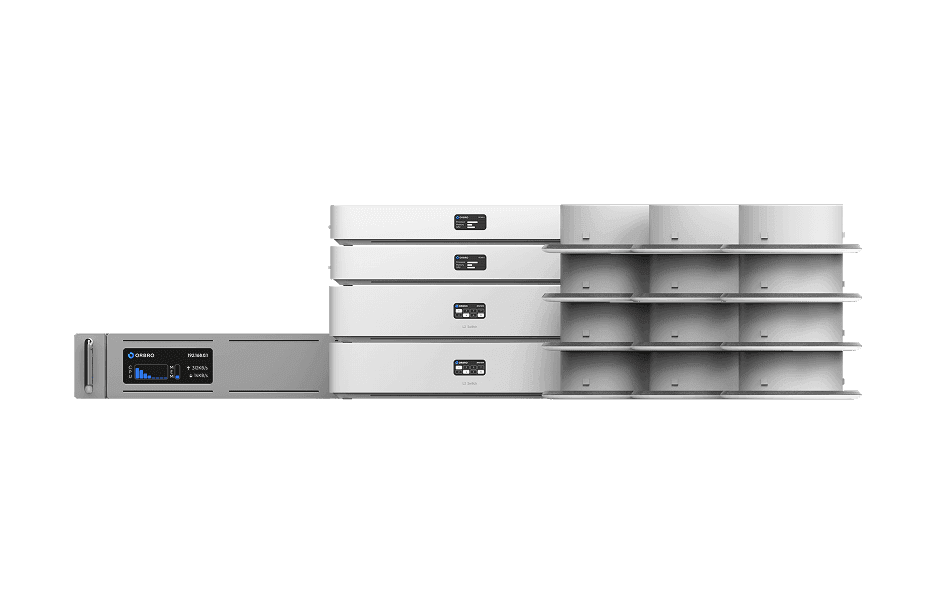
UWB Location Tracking
UWB Location Tracking
Enhance worker safety and precisely manage the movement of assets and equipment through real-time tracking, improving productivity and operational efficiency at the same time.
Learn More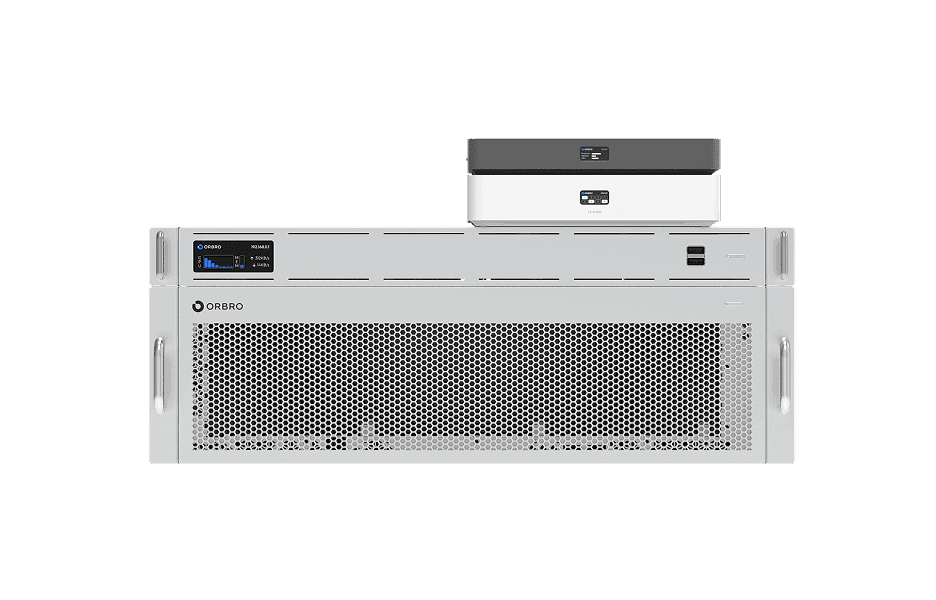
Video-based Location Tracking
Video-based Location Tracking
Analyze camera footage to convert movements of people and vehicles into coordinates, providing map-based real-time tracking along with path and dwell-time analysis.
Learn More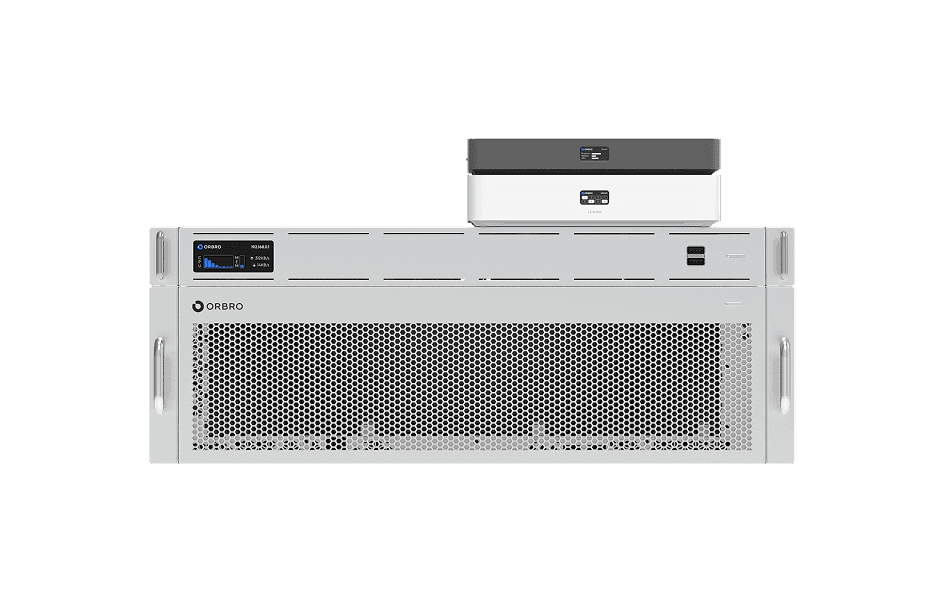
Worker Safety Management
Worker Safety Management
Automatically detect events such as falls, collapses, and intrusions. Alerts are sent immediately and situations are recorded to strengthen site safety and support rapid response.
Learn More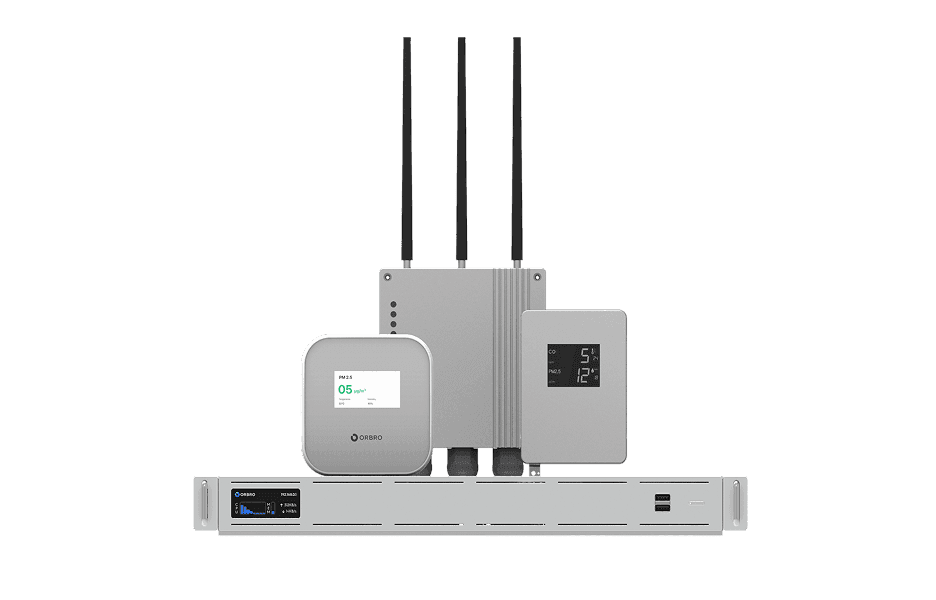
Sensor Monitoring
Sensor Monitoring
Provide a wide range of monitoring solutions required on site, from LoRa communication sensors to CO₂ detectors and air quality monitors.
Learn More