Smart City Solution
Integrated Urban Disaster Monitoring
Bring data scattered across departments onto one screen and reach response decisions sooner. Agencies under network separation are built on a server inside the government building.

Display disaster data and responder locations on one operational map
Figures from the Korea Meteorological Administration and the Flood Control Office arrive by API, while monitoring video and facility sensors are integrated from the equipment already in place. Locations of response personnel and equipment are collected directly by tags and receivers installed on site. Which items can be integrated is confirmed case by case, following what each agency makes available.
ORBRO Server
Indicators from the Korea Meteorological Administration and the Flood Control Office, monitoring video and facility sensor data are integrated and shown on the control room screen. Locations of response personnel and equipment use information collected from field tags and receivers or from an integrated location system. Alerts follow the criteria you set and their history is retained, and in network separated environments it is built on a server inside the government building.



Integrated Disaster Data View
Roads, rivers, facilities and video belong to different departments, and all of it is aligned to coordinates and laid out on one screen. The scope of integration is set by the data sharing agreements reached with each agency.
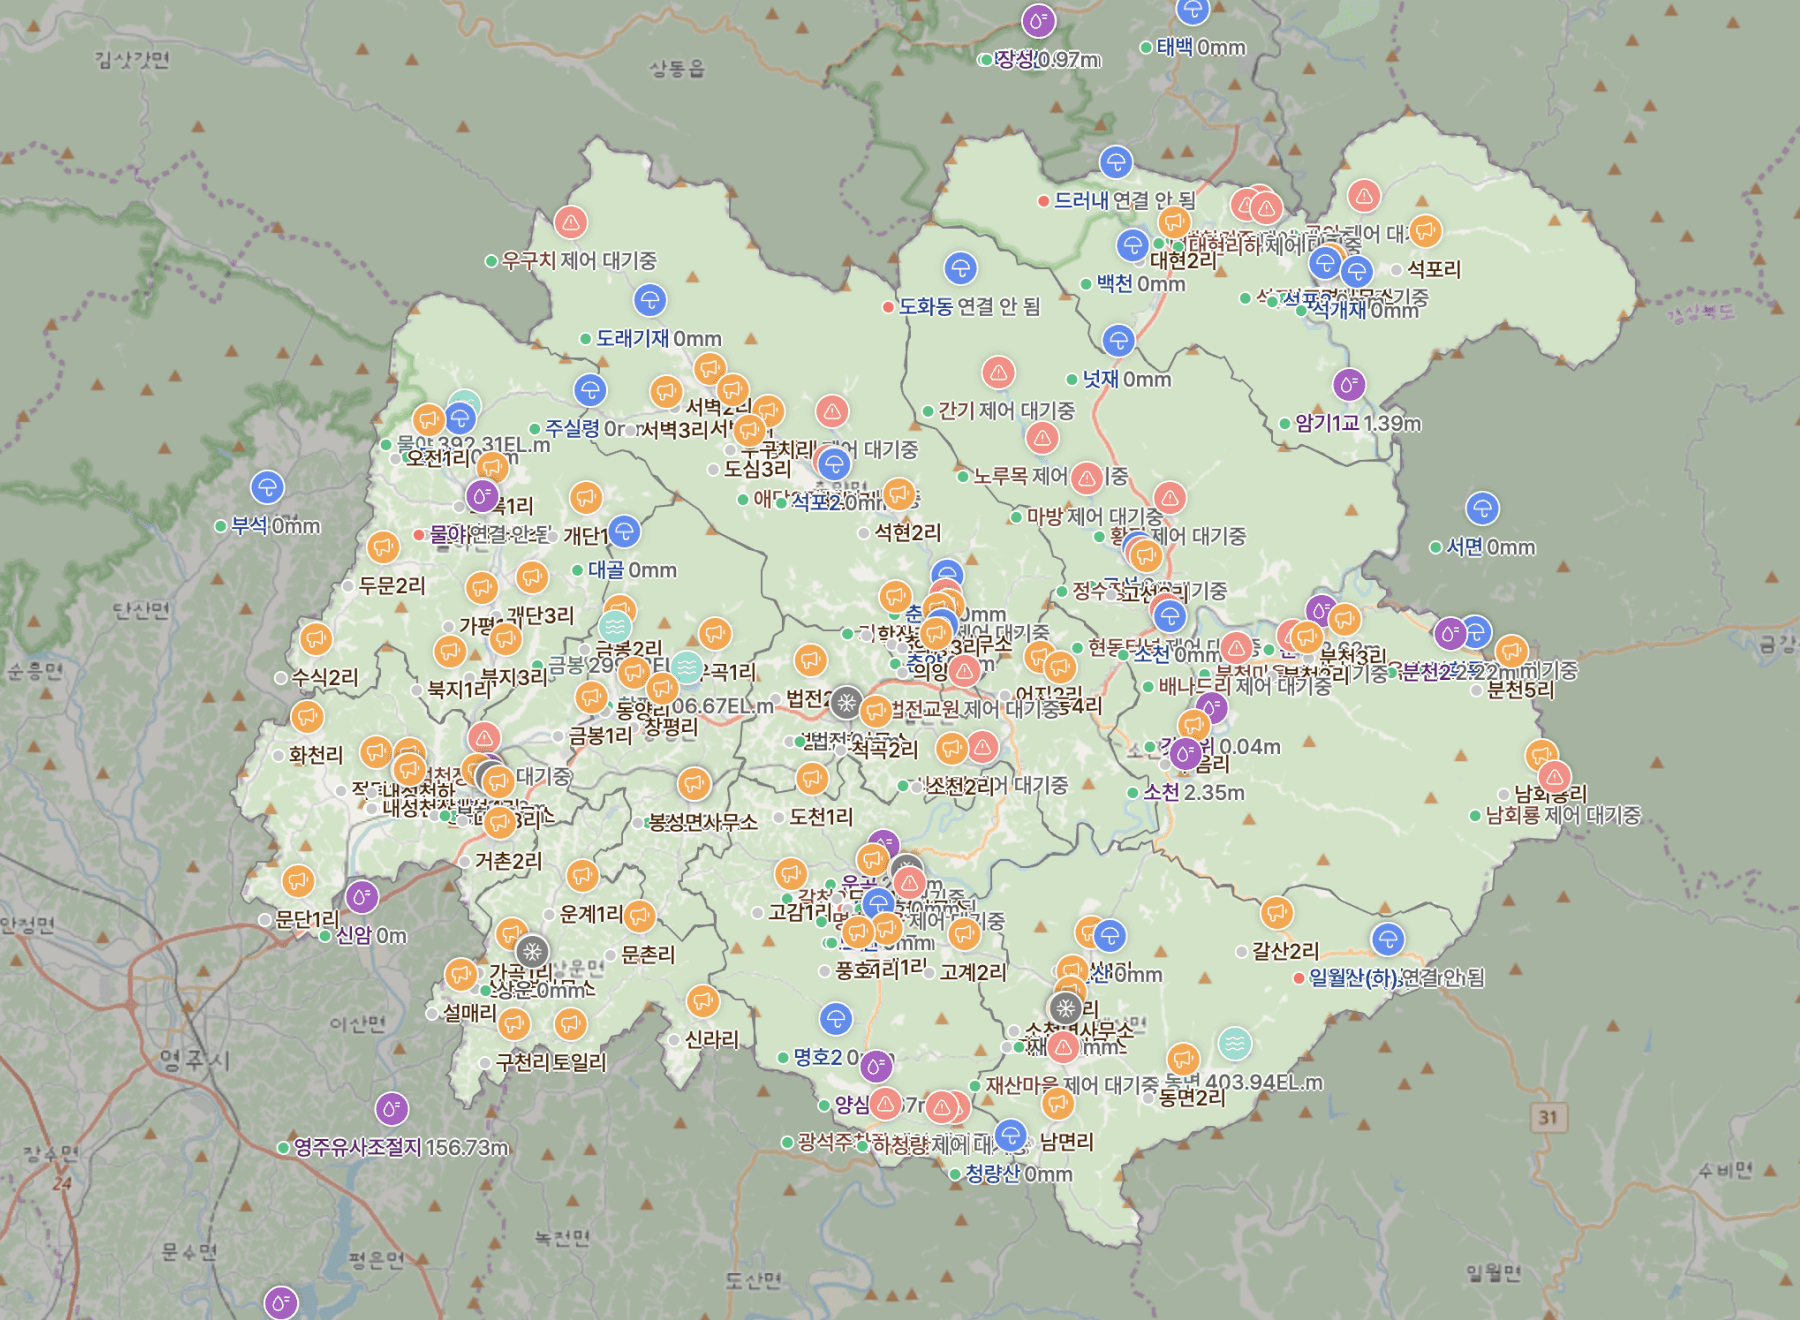
Integrated monitoring of urban infrastructure data
Roads, rivers, facilities and video each sit with a different department. ORBRO Server takes the data in whatever form each system provides and lays it out on a single screen, so scattered information can be viewed together without removing the monitoring equipment already in place. Both API and file based integration are supported for each department, while the actual scope is set by the data sharing agreements.
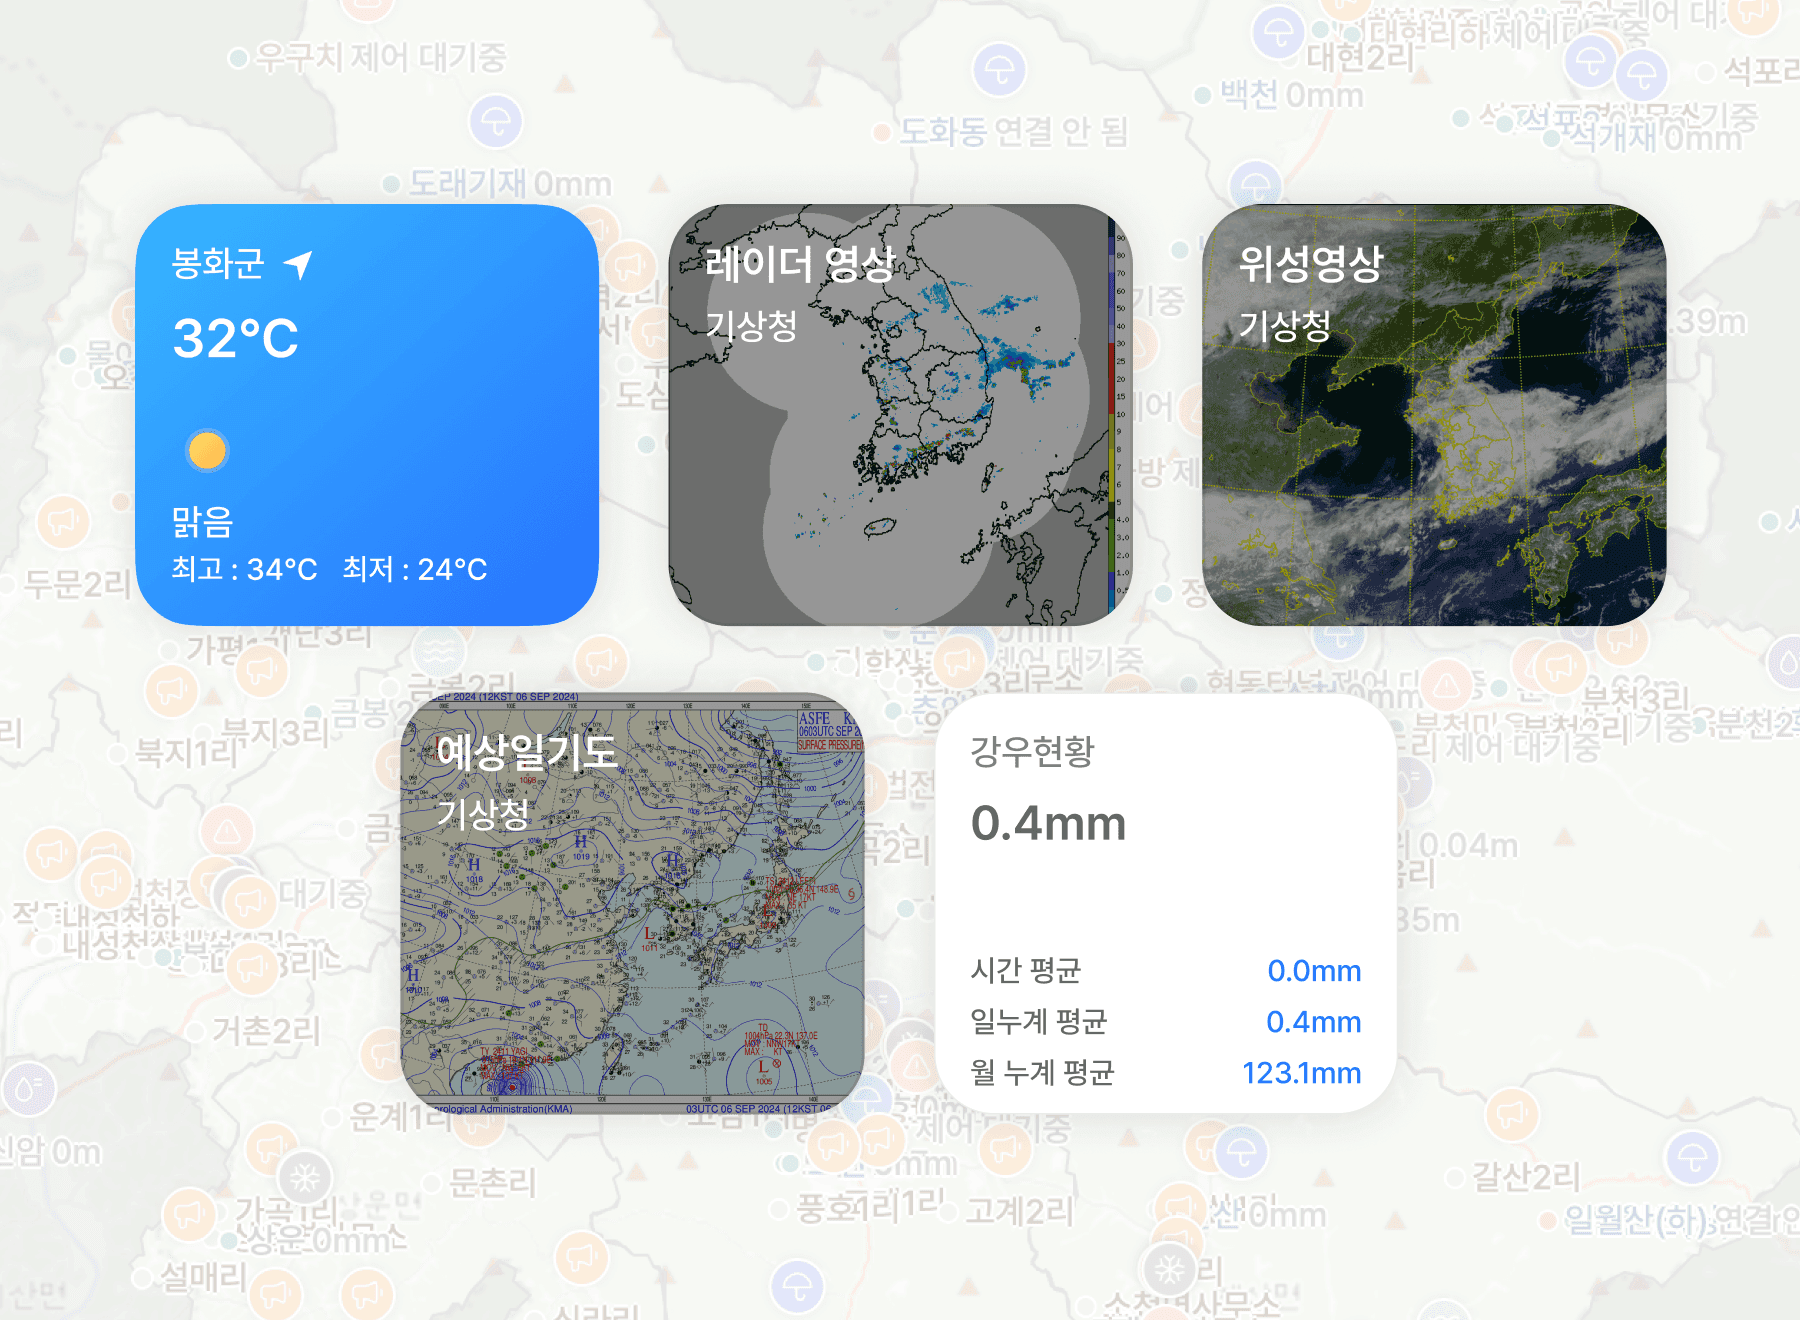
Weather indicators collected and placed on the map
The server in the control room periodically pulls rainfall, wind speed and temperature readings from the Korea Meteorological Administration and places them on the map. Because it connects data that is already published rather than putting up new observation equipment, the scope of the build shrinks accordingly. Readings are shown by region, and the API approval process is handled together with the client.
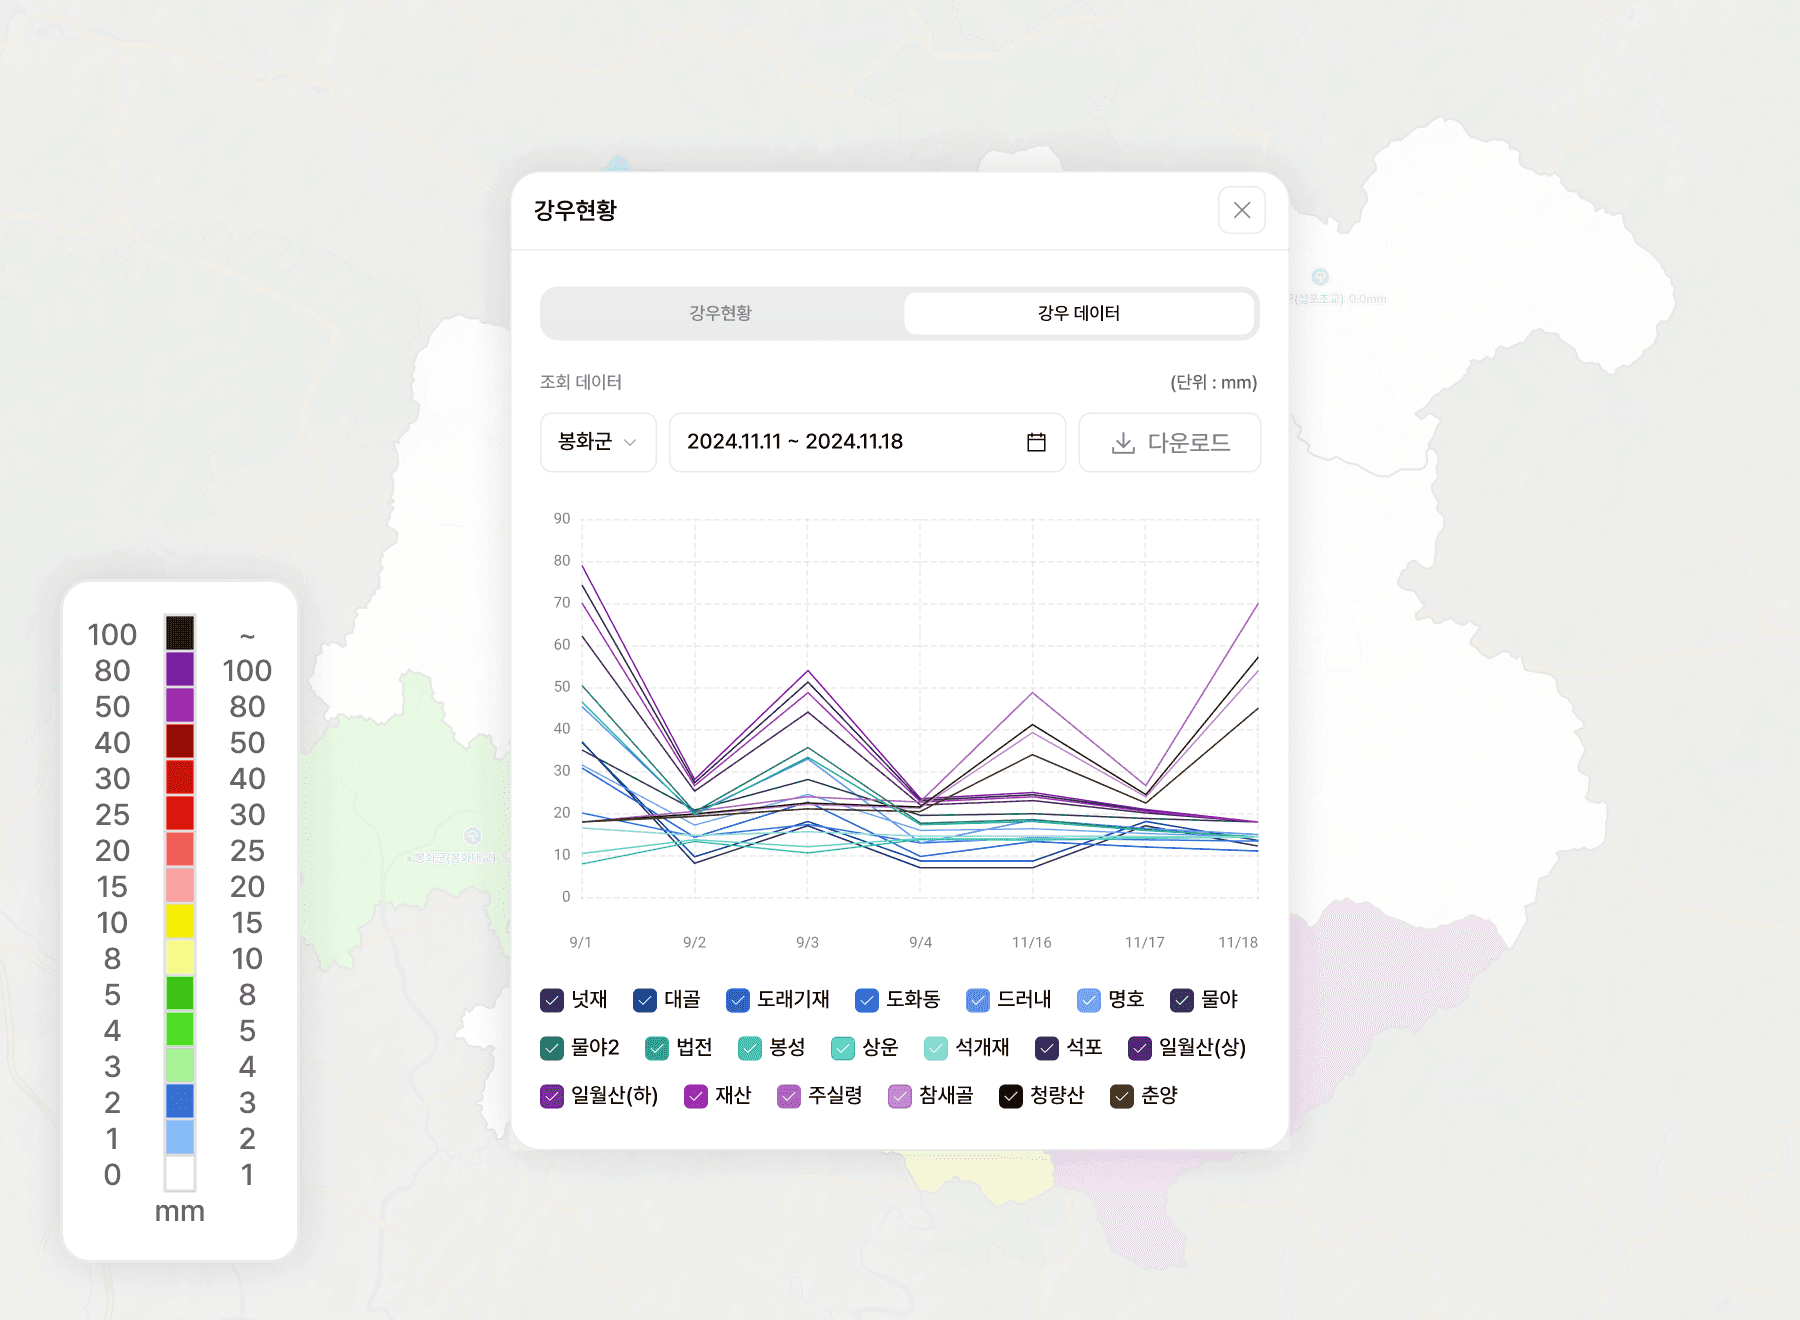
Rainfall by region with threshold points marked
How much rain is falling right now is shown in color on the map by administrative district, and districts past the preset rainfall threshold are picked out separately. A table of numbers alone does not show where to look first. Hourly rainfall and cumulative rainfall are read separately, which distinguishes a short downpour from rain that has continued for a long time.
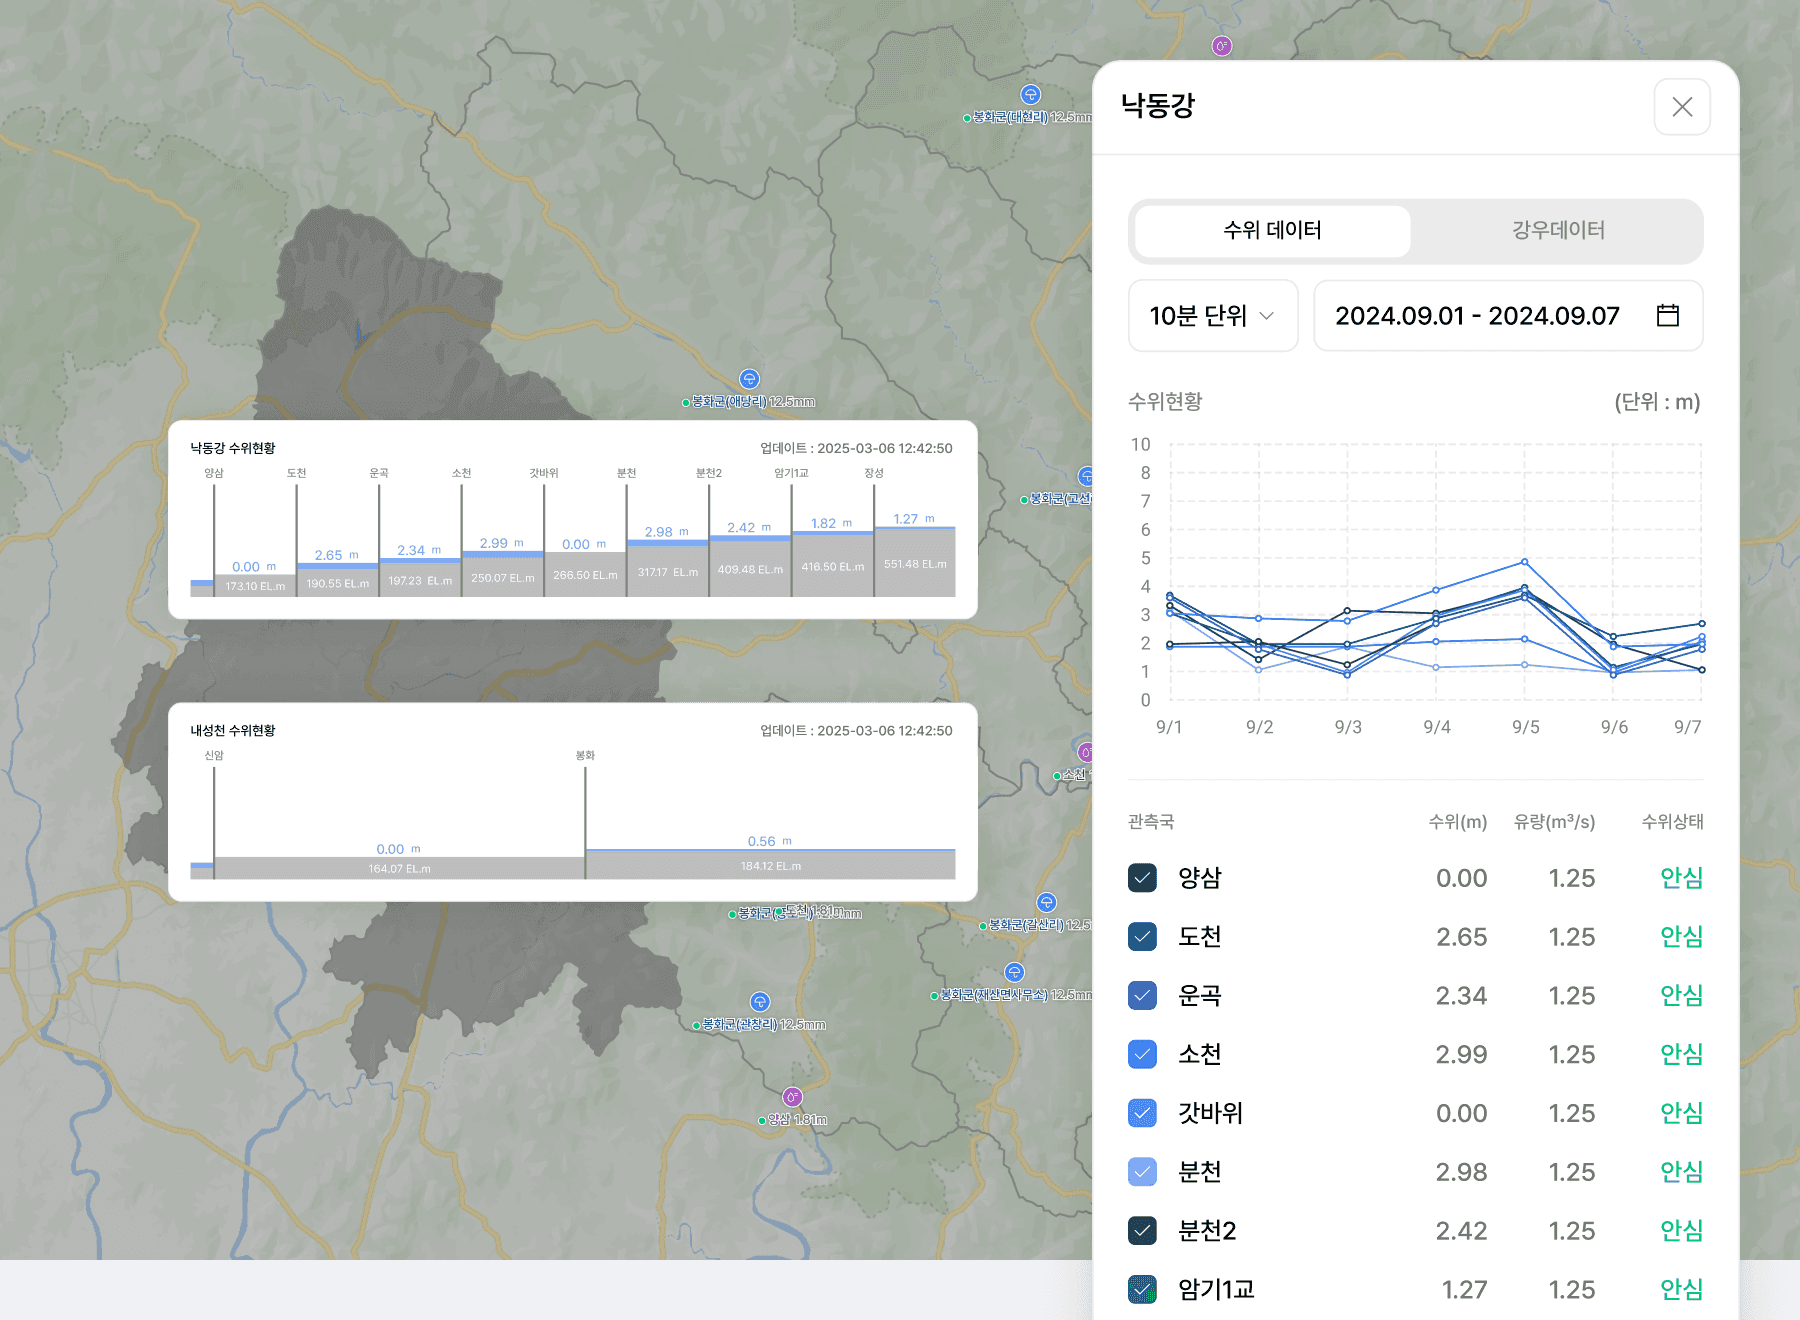
River water level and flow visualized
Check the water level and response stage of each river section by color. Water levels and flow rates provided by the Flood Control Office are received and compared against the watch, caution and warning thresholds set for each point. Staff refer to the trend in water level and the staged thresholds when reviewing the order of response.
Existing Monitoring System Integration
The monitoring system you use today stays in place, and the rollout starts by connecting only the information you need. Items missing from the current screen, such as the locations of response personnel and equipment, are added first.
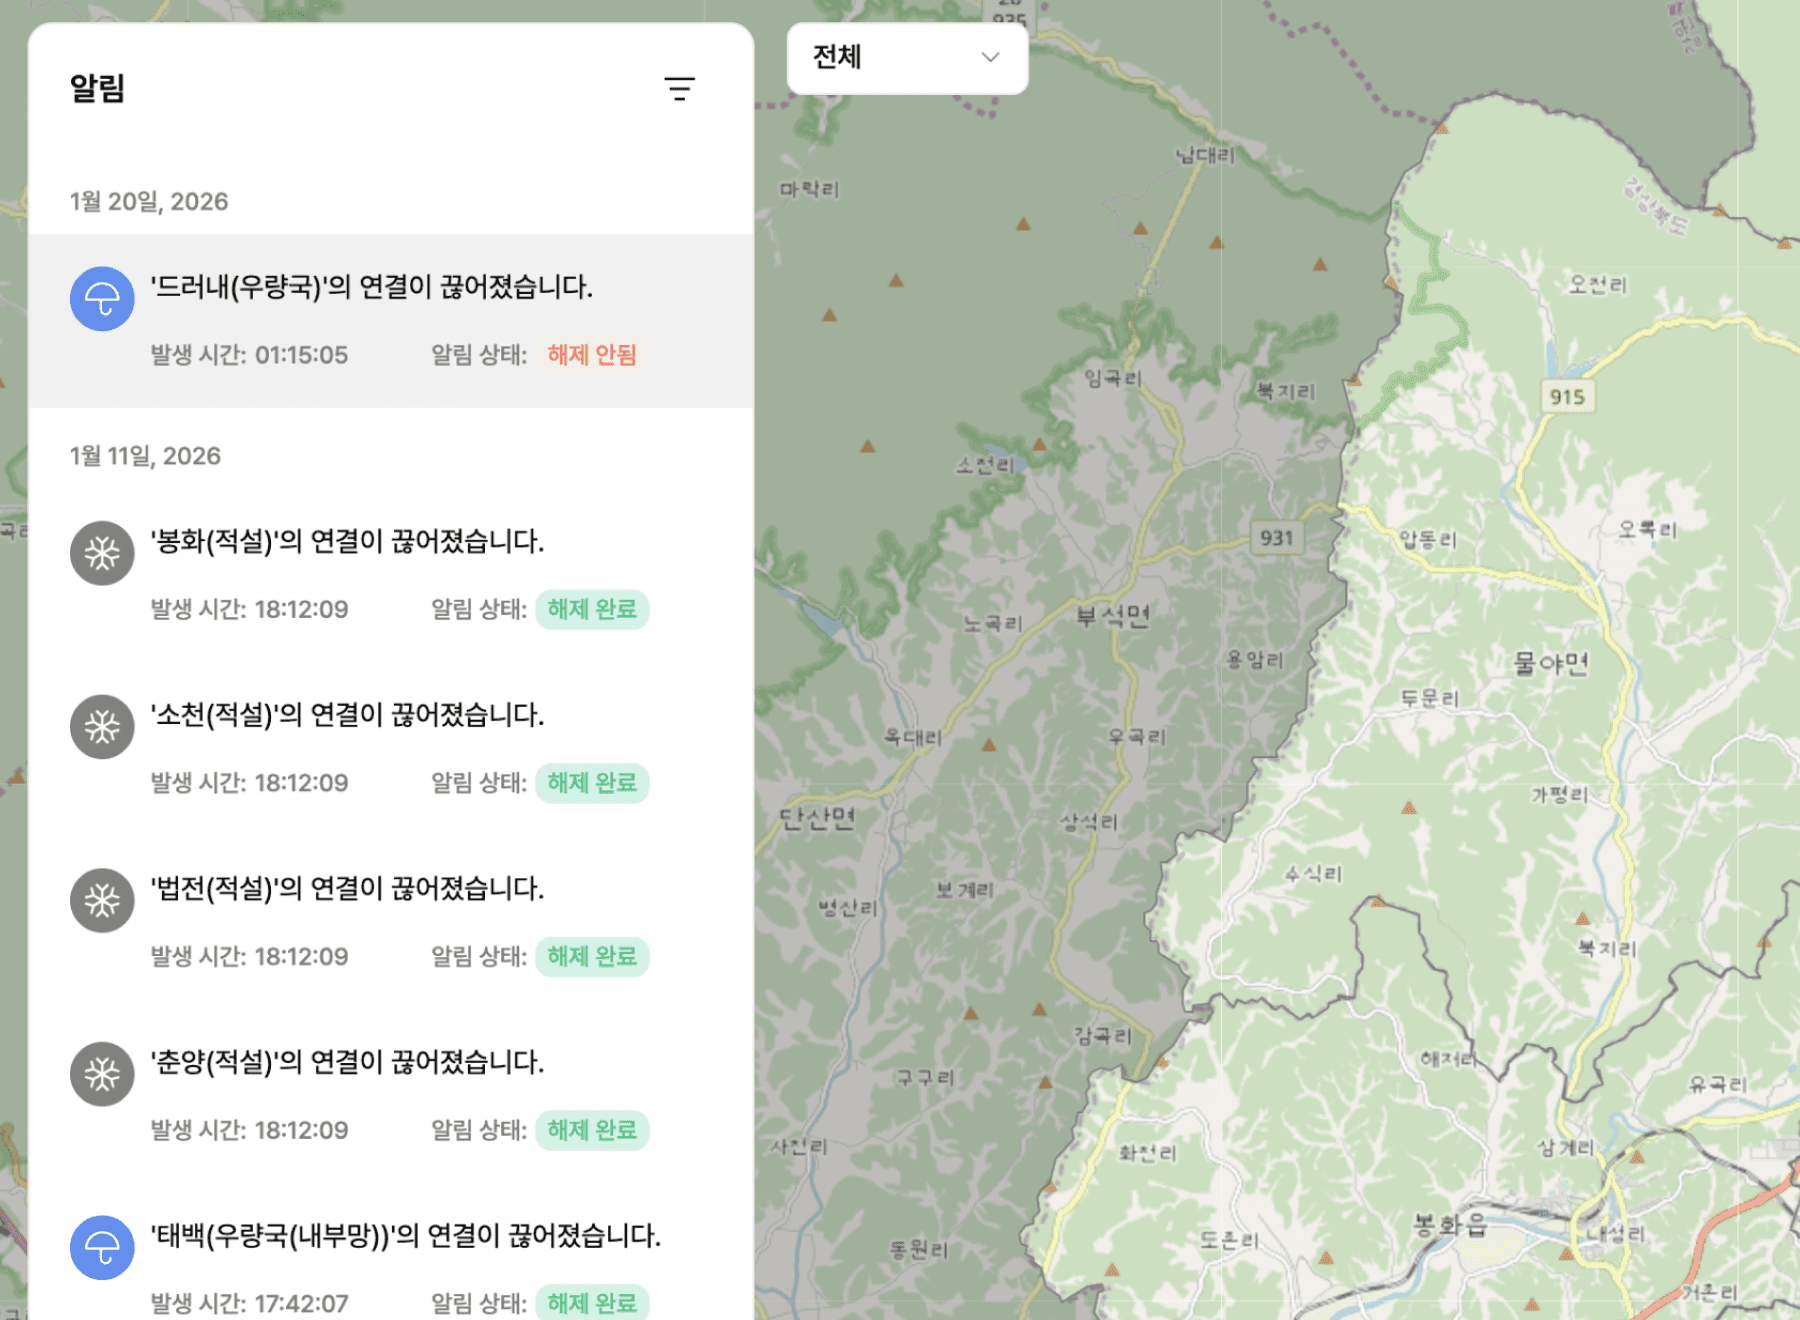
Connection status of field observation devices
The connection status of observation devices scattered across the field, such as rain gauge stations and water level gauges, is checked continuously, and a list flags any device whose signal has dropped. The hardest thing in a disaster is not a bad reading but no reading at all. The time a signal dropped and the time it recovered are both kept, which tells you whose device to repair first.
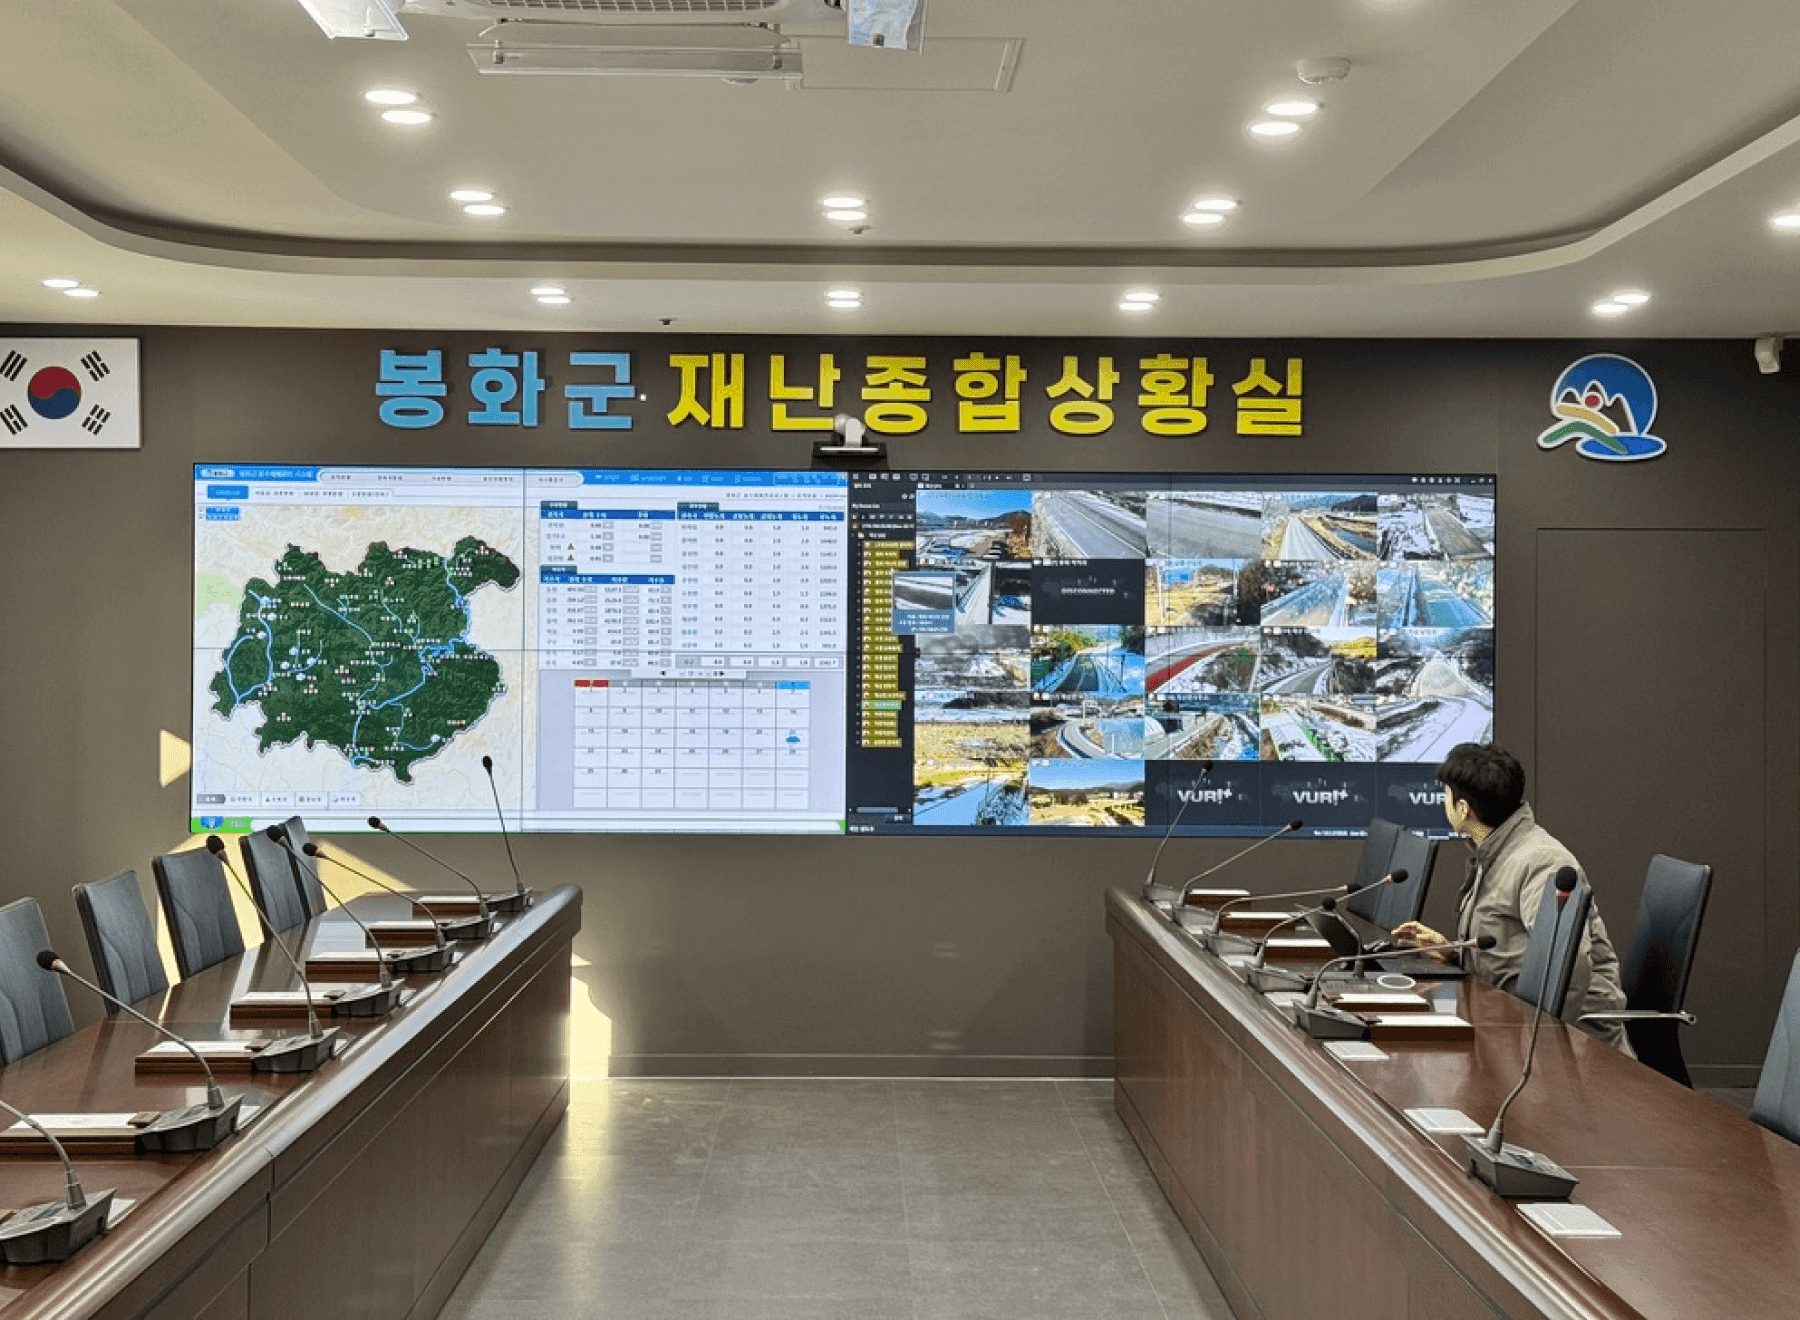
Control room layouts and real-time display
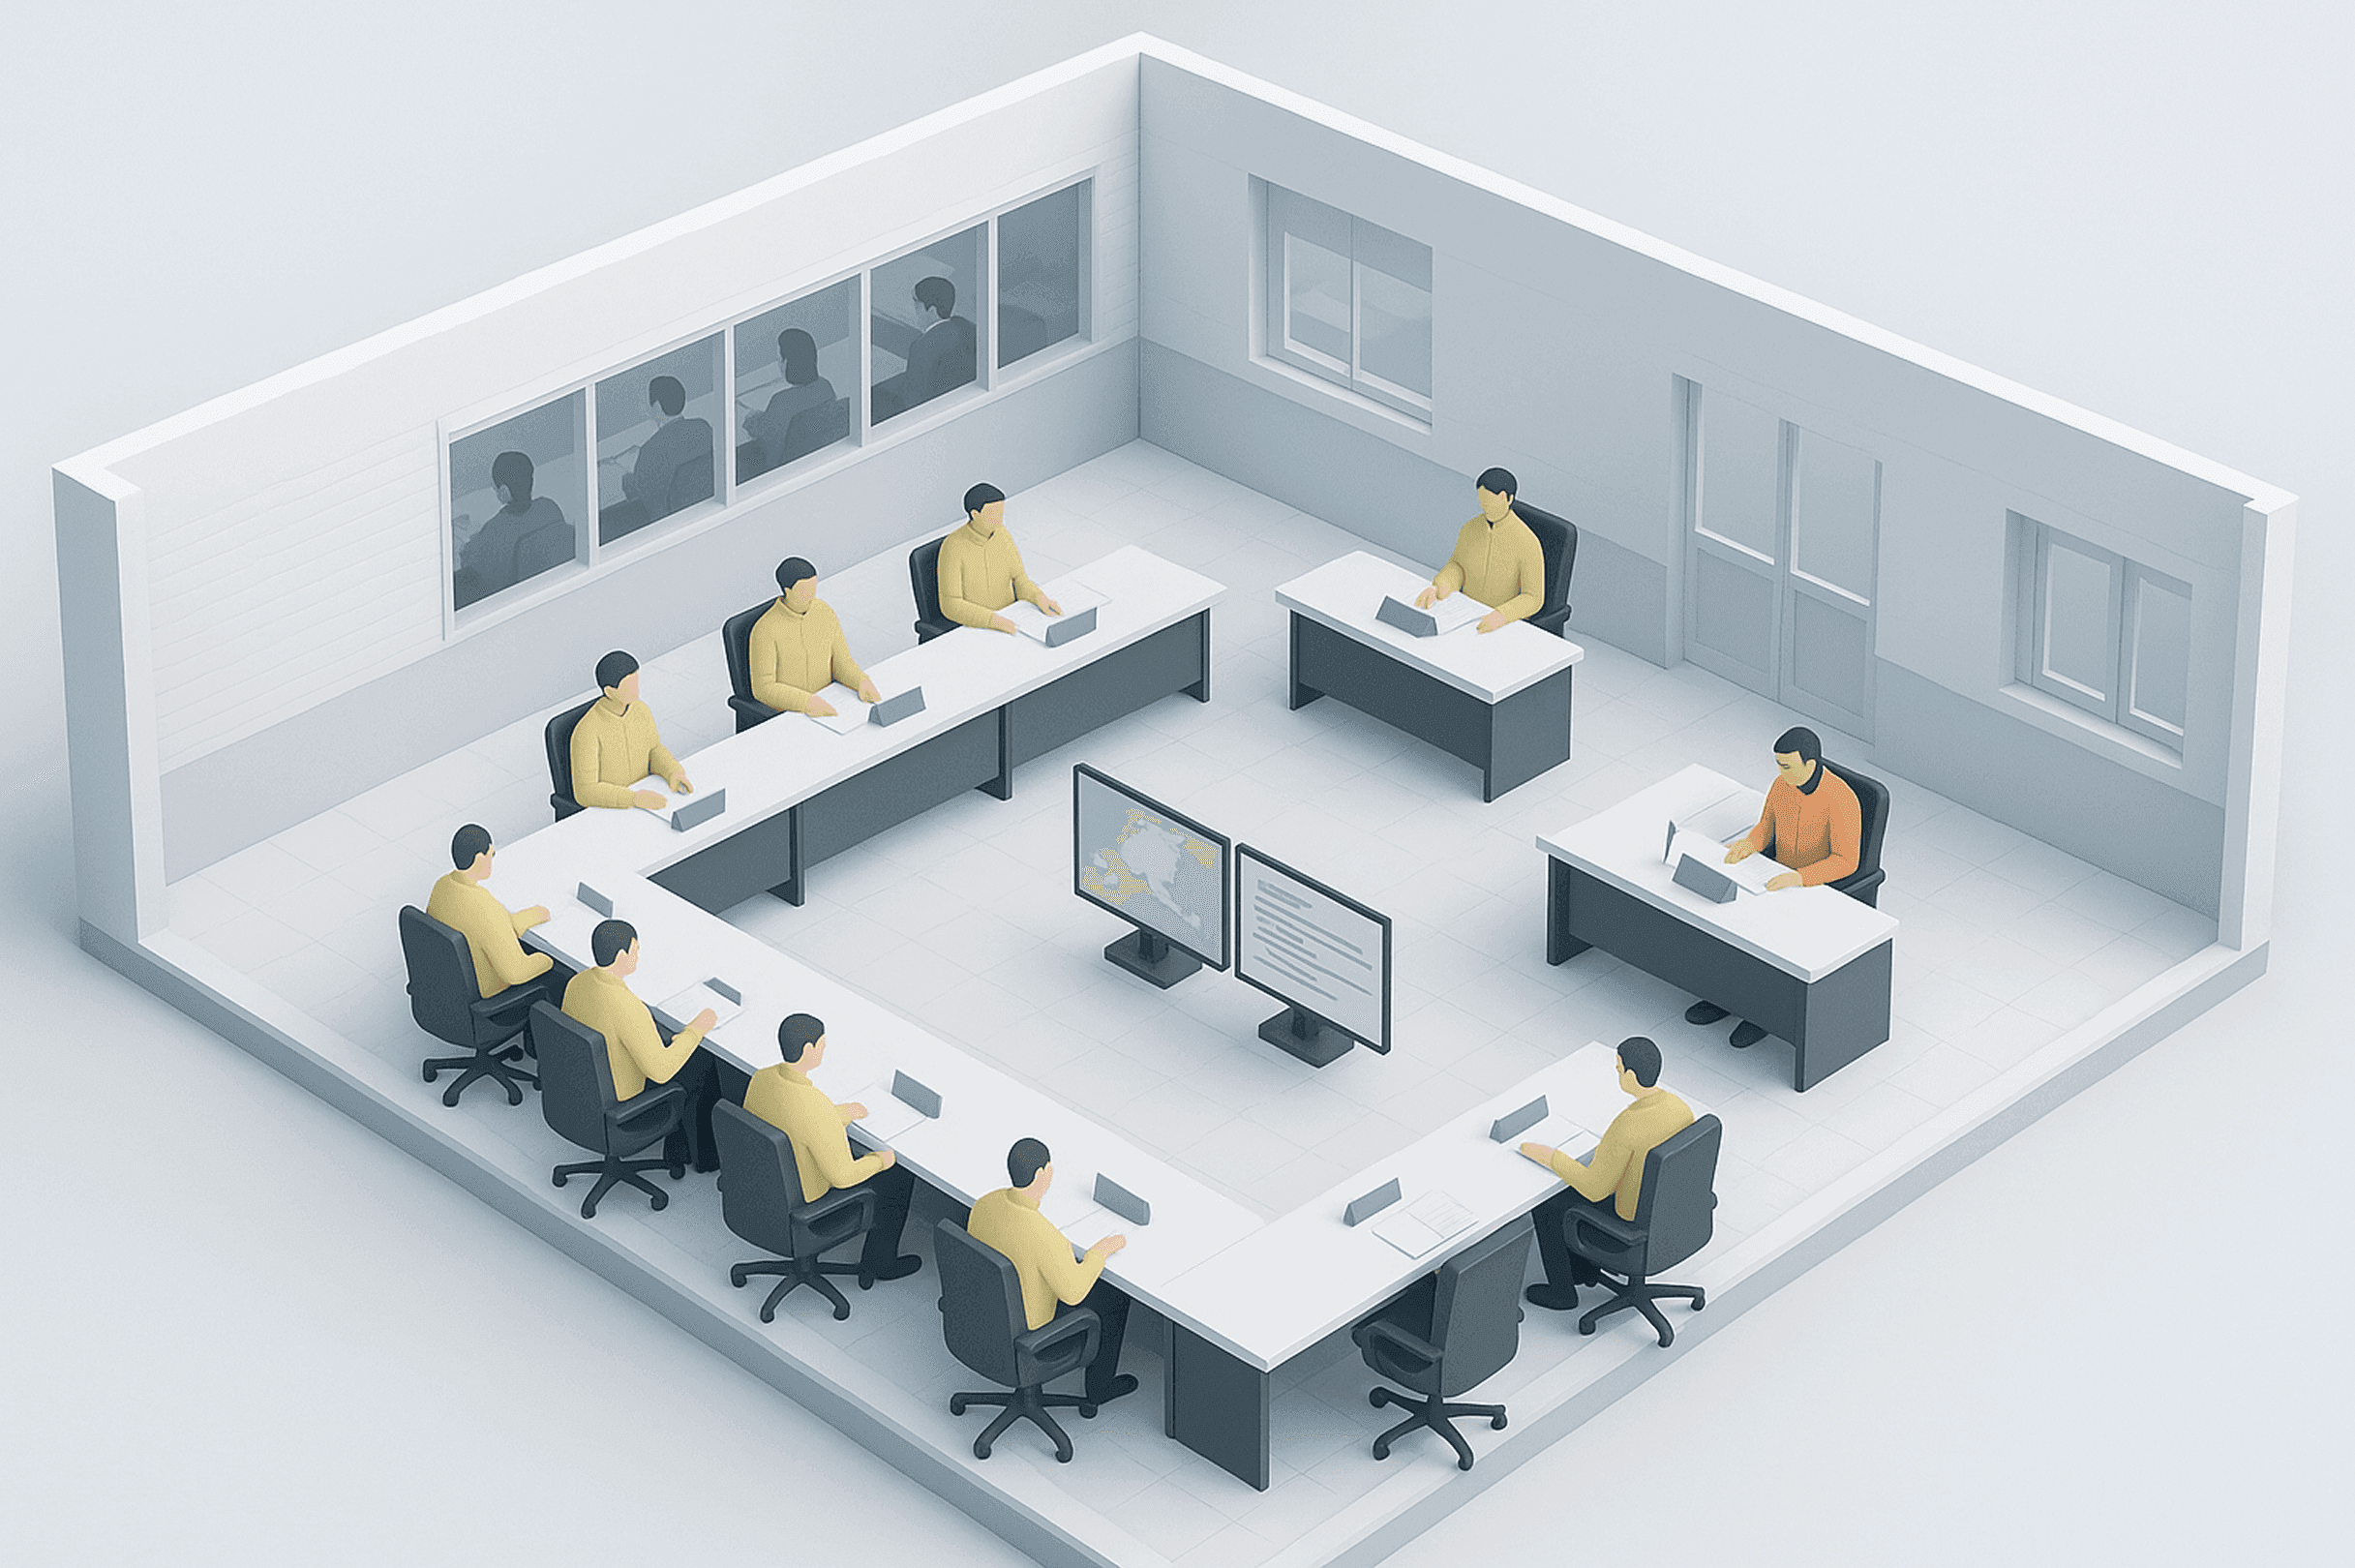
Video, alert history and key indicators are laid out across the large screen. A control room is a space where several people judge from the same screen, so the layout is adjusted to each agency's response procedure. Layouts are saved per shift, and when the situation escalates the screen switches to the arrangement decided in advance.
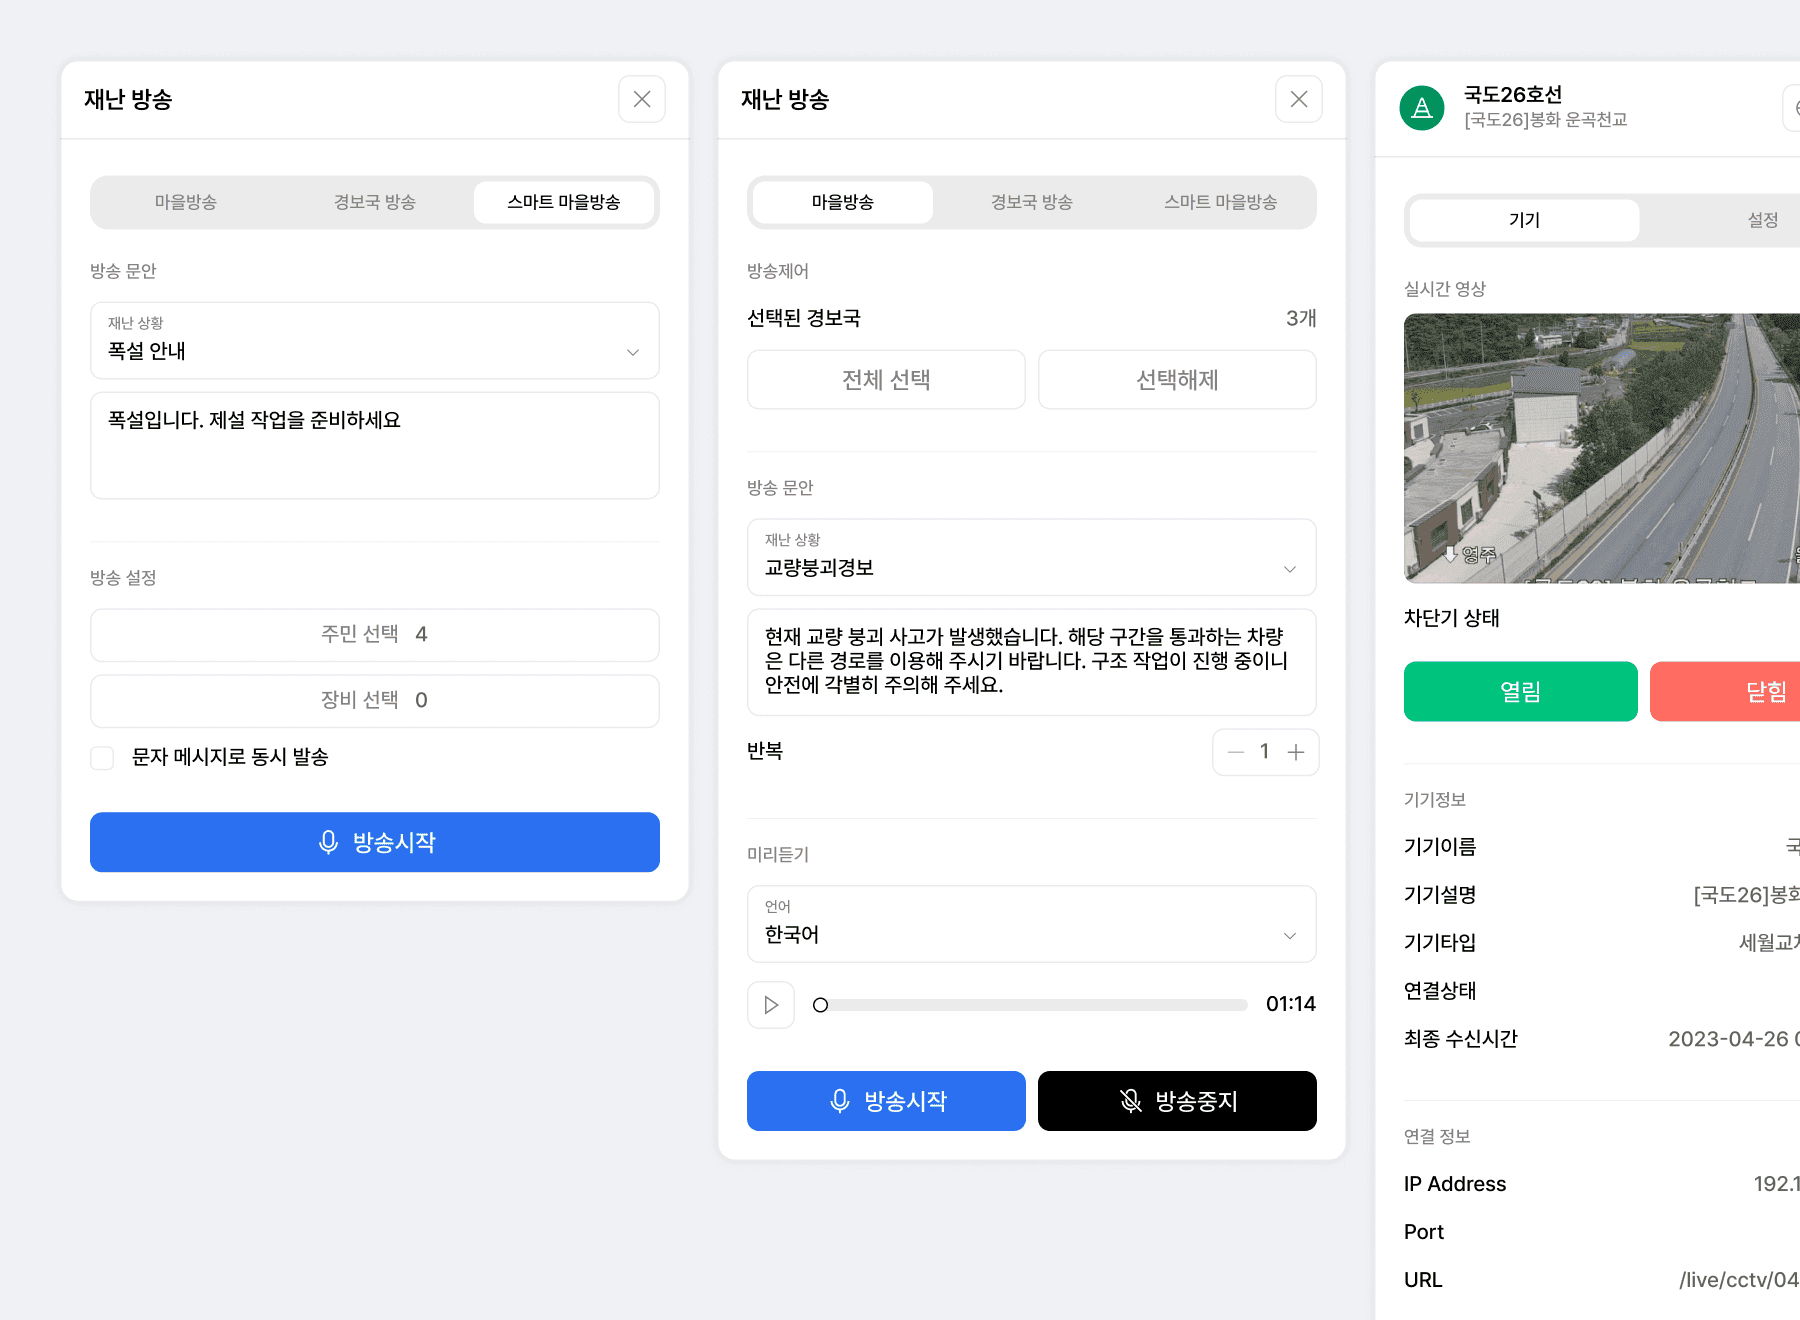
Remote response linked to resident notification
Village broadcasts, emergency text messages and facility control each have their own equipment and their own owning department. They are connected by sending a request from the control room screen, with operating rights and approval steps configured alongside. For remote operation of equipment, the scope of responsibility is settled at the contract stage and the integration scope is confirmed with the equipment vendor.
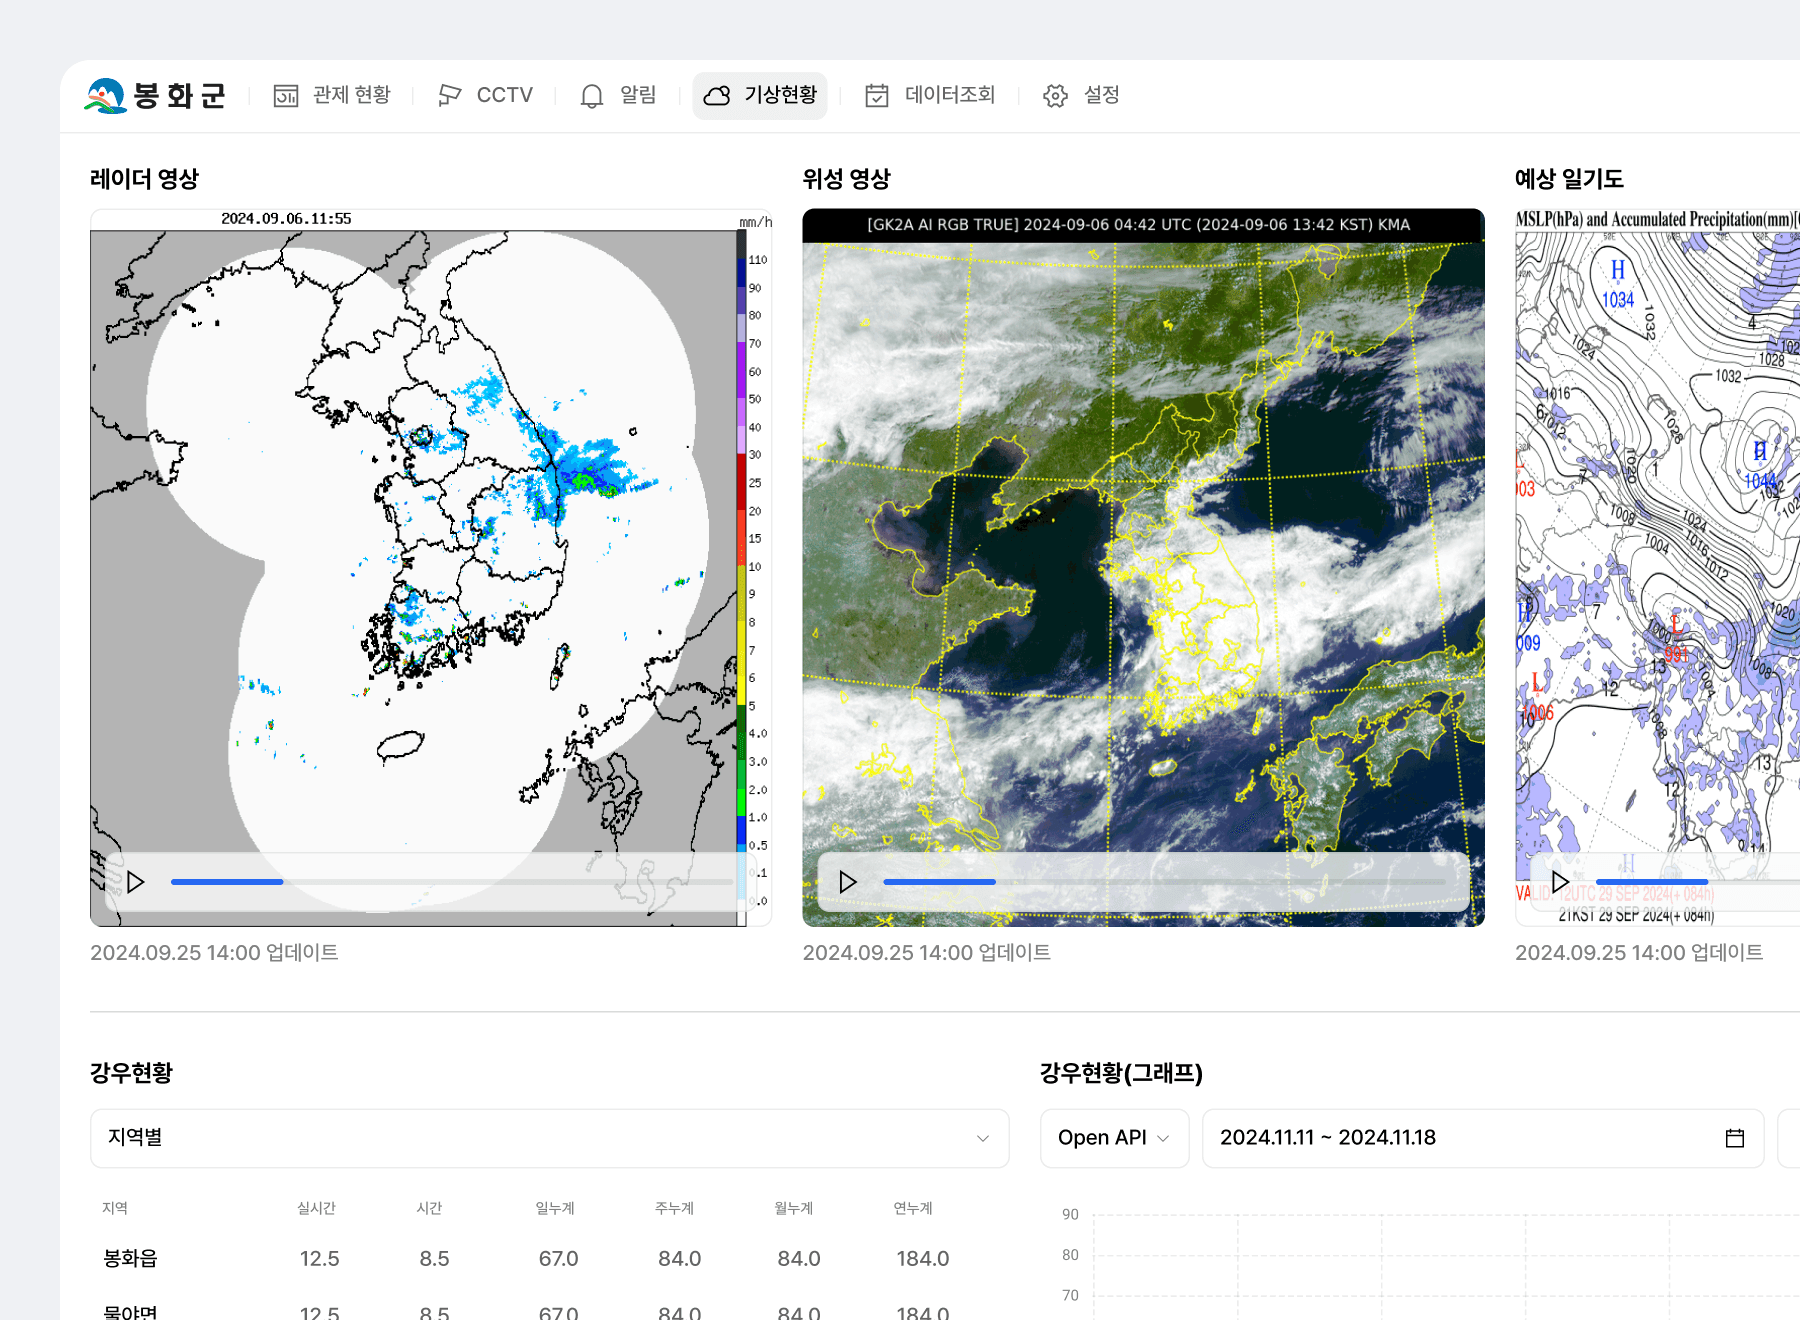
Multiple indicators compared for post-incident analysis
Rainfall, water level and alert occurrences are placed side by side across several panels to show how each moved over time. Once the situation ends, this is used to review whether the response came at the right moment and to adjust the next set of thresholds. You can query indicator trends over a chosen period and export the comparison against alert timestamps as a report.
Recommended Products
Components Based on ORBRO OS
Each solution operates with various products connected on top of ORBRO OS. Configurations can be flexibly adjusted depending on the scope of application and on-site conditions.
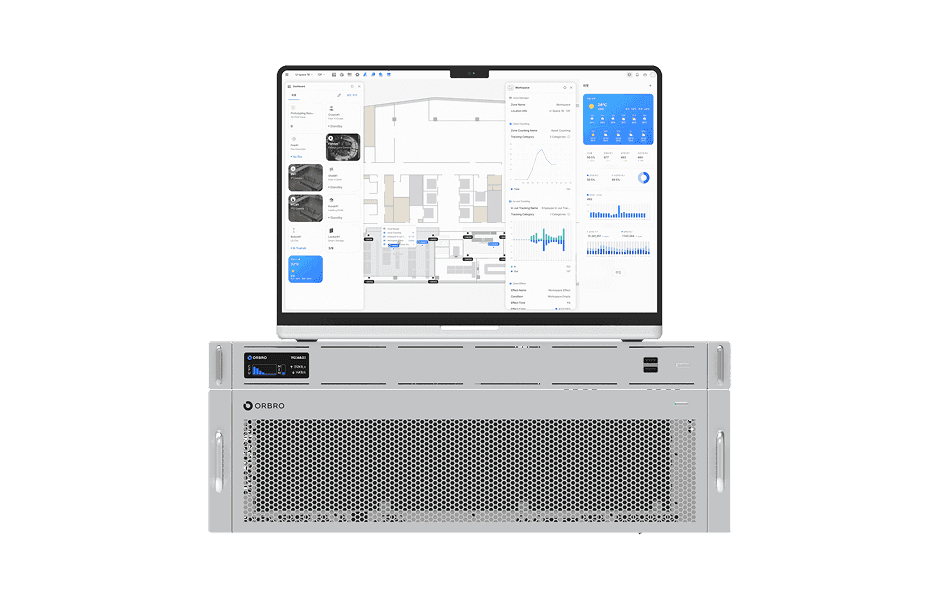
ORBRO OS2
ORBRO OS2
Align location, video, and sensor data on a spatial layer to turn all on-site situations into a single operational workflow.
Learn More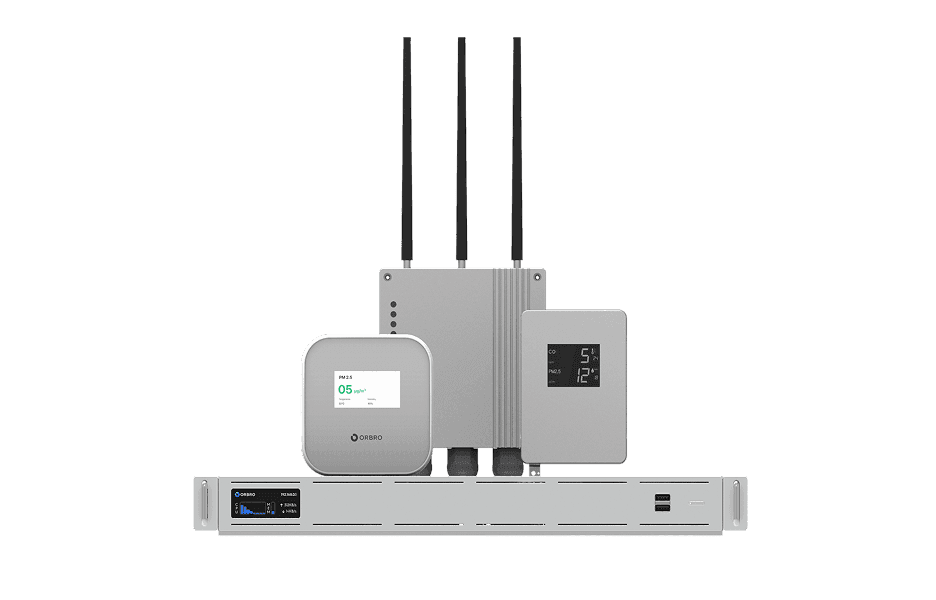
Sensor Monitoring
Sensor Monitoring
Provide a wide range of monitoring solutions required on site, from LoRa communication sensors to CO₂ detectors and air quality monitors.
Learn More