Retail Solution
Visitor Flow Analytics
Visitors' zone visit records remain as material for reviewing an exhibition rework. Movement of the visitors who carry tags is analyzed for exhibit placement and guidance operations.

Aggregate visitor movement paths and zone-level dwell time
A visitor pass holding a UWB Tag is handed out at entry and collected at exit. Zone visits and dwell time of the visitors who carry tags are compiled into heatmaps and reports. When tags go to only part of the audience, results are read against who received them and the observation period.
Dome Camera
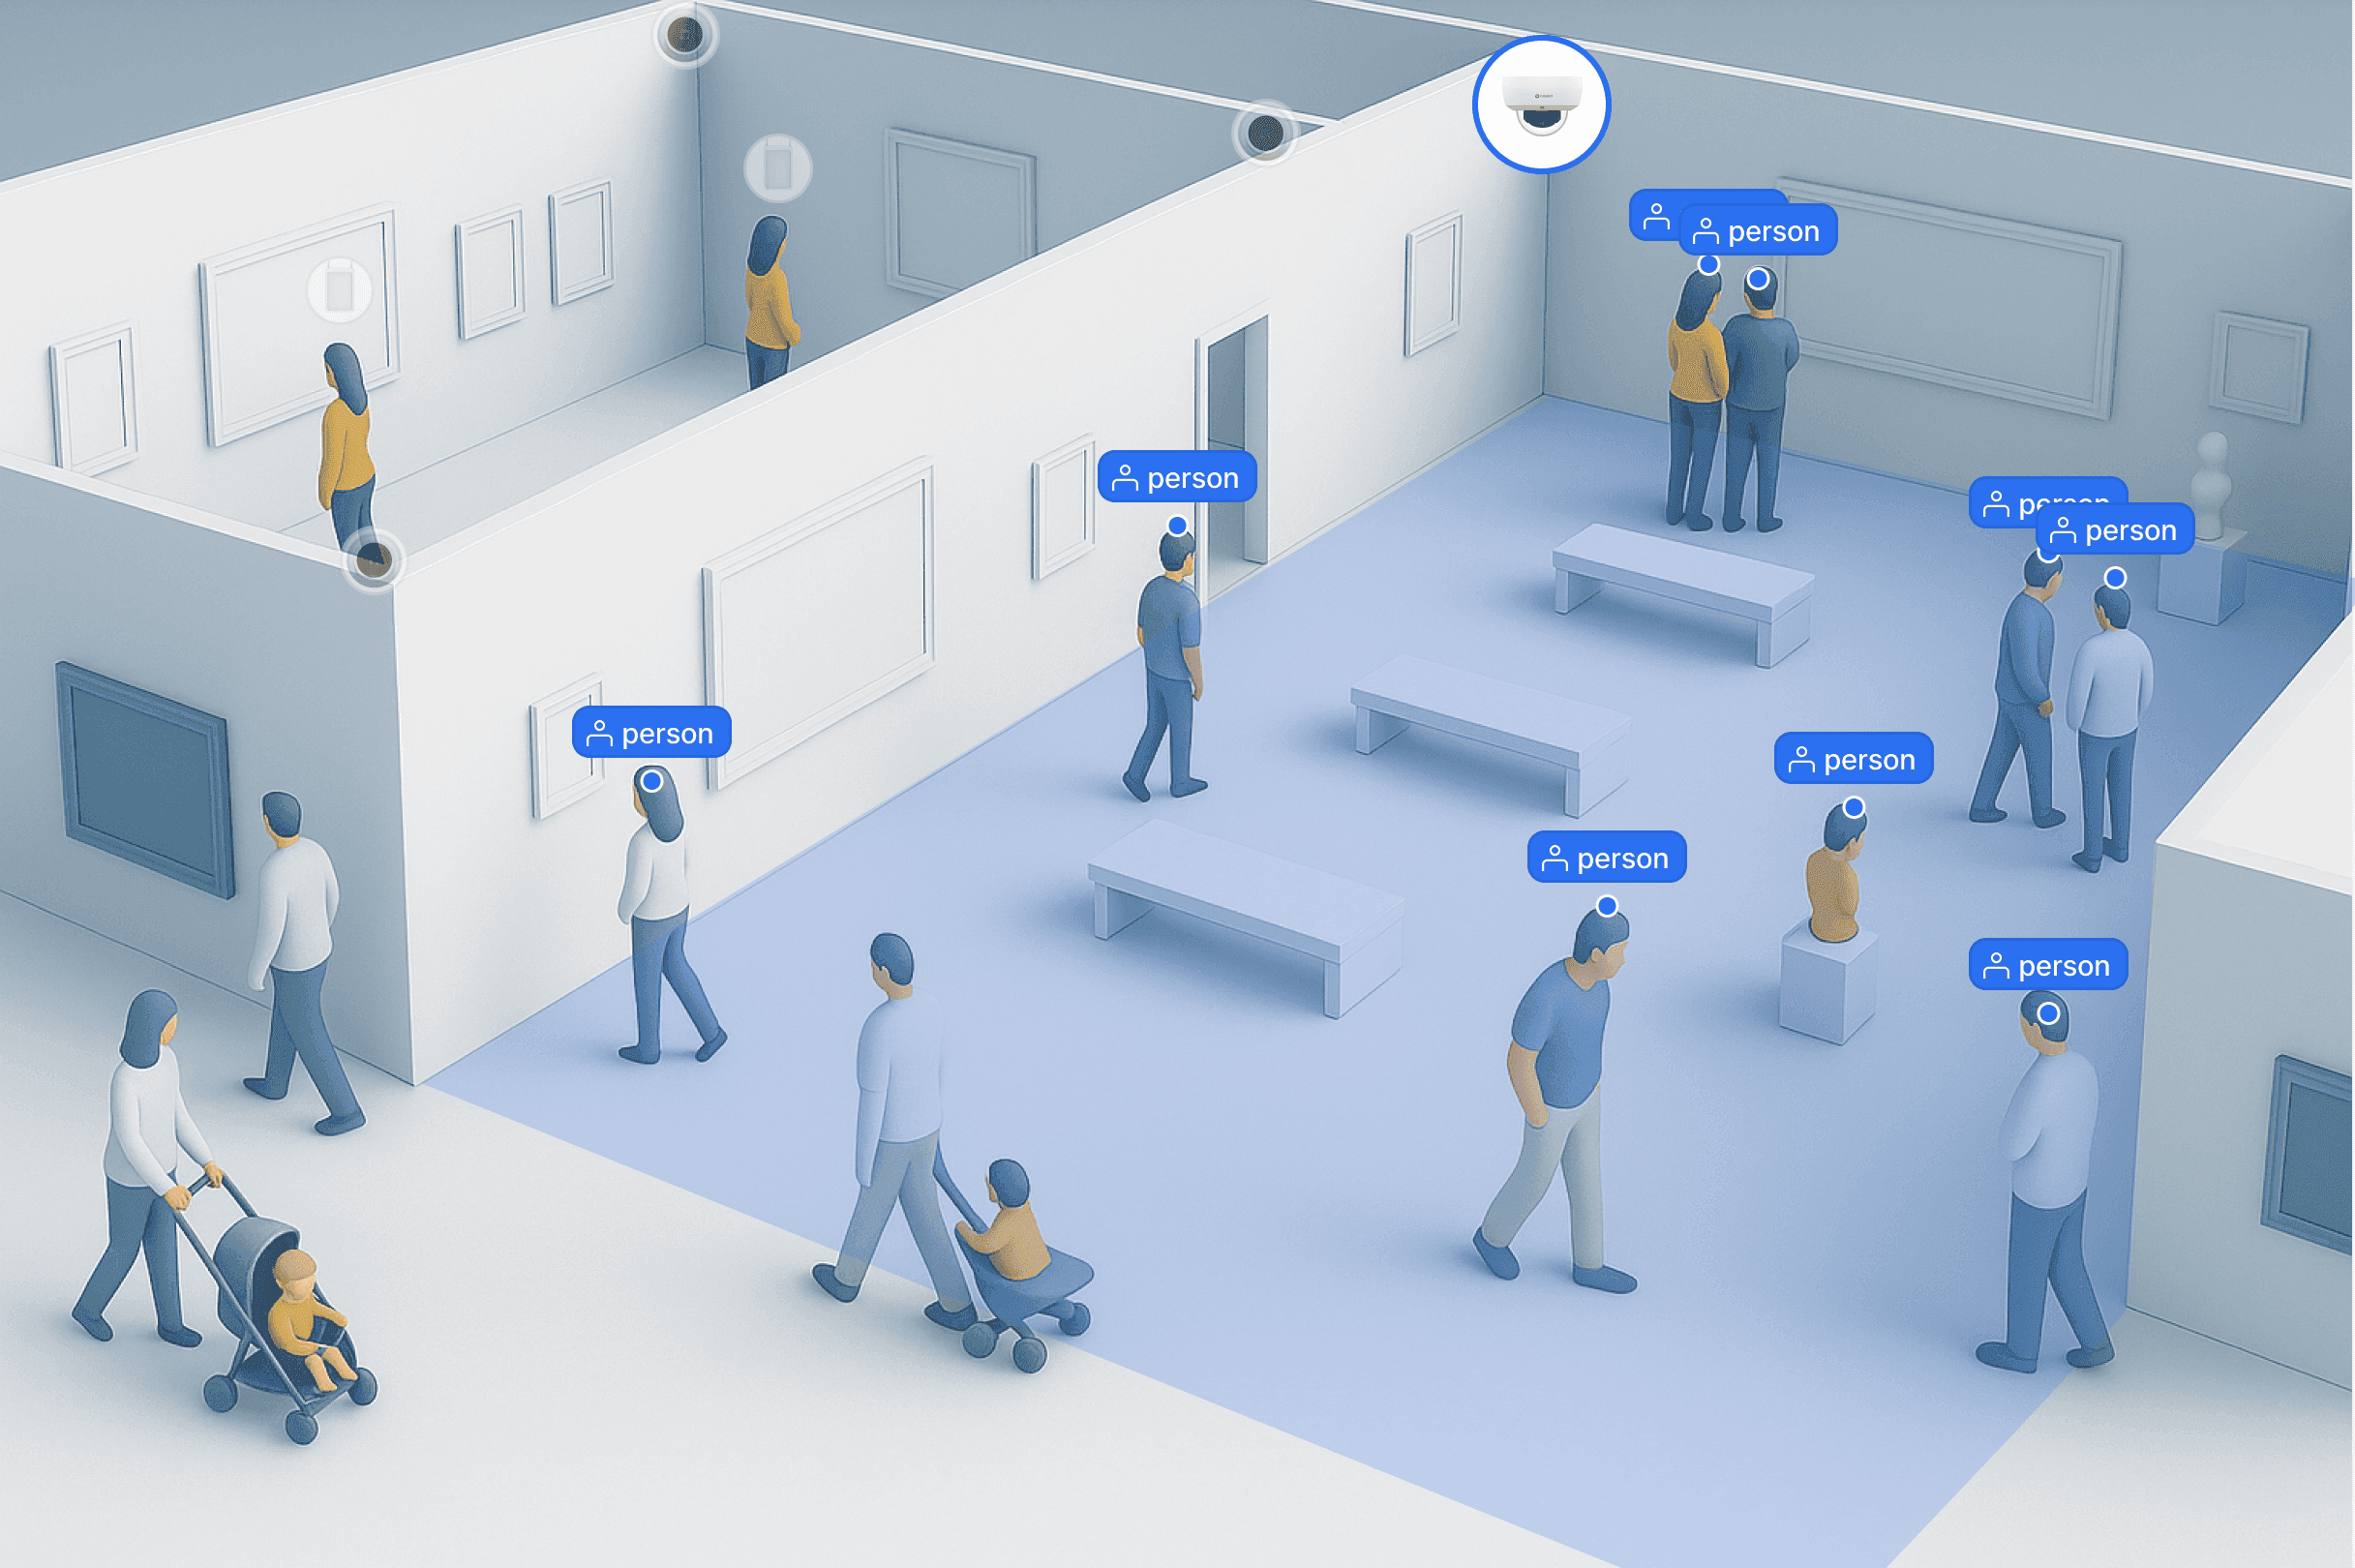
Camera video shows visitor density by zone. Records from tagged visitors and counts from sections covered by video observe different populations. When comparing the two, read them against the zones and hours each device observed.









Visitor Movement Path Recording
The visitor badge tag records which zones a visitor passed through and in what order, and no identity is kept. Guidance plays automatically in front of a work, and entry into a restricted zone alerts the person in charge.
Visitor location by zone
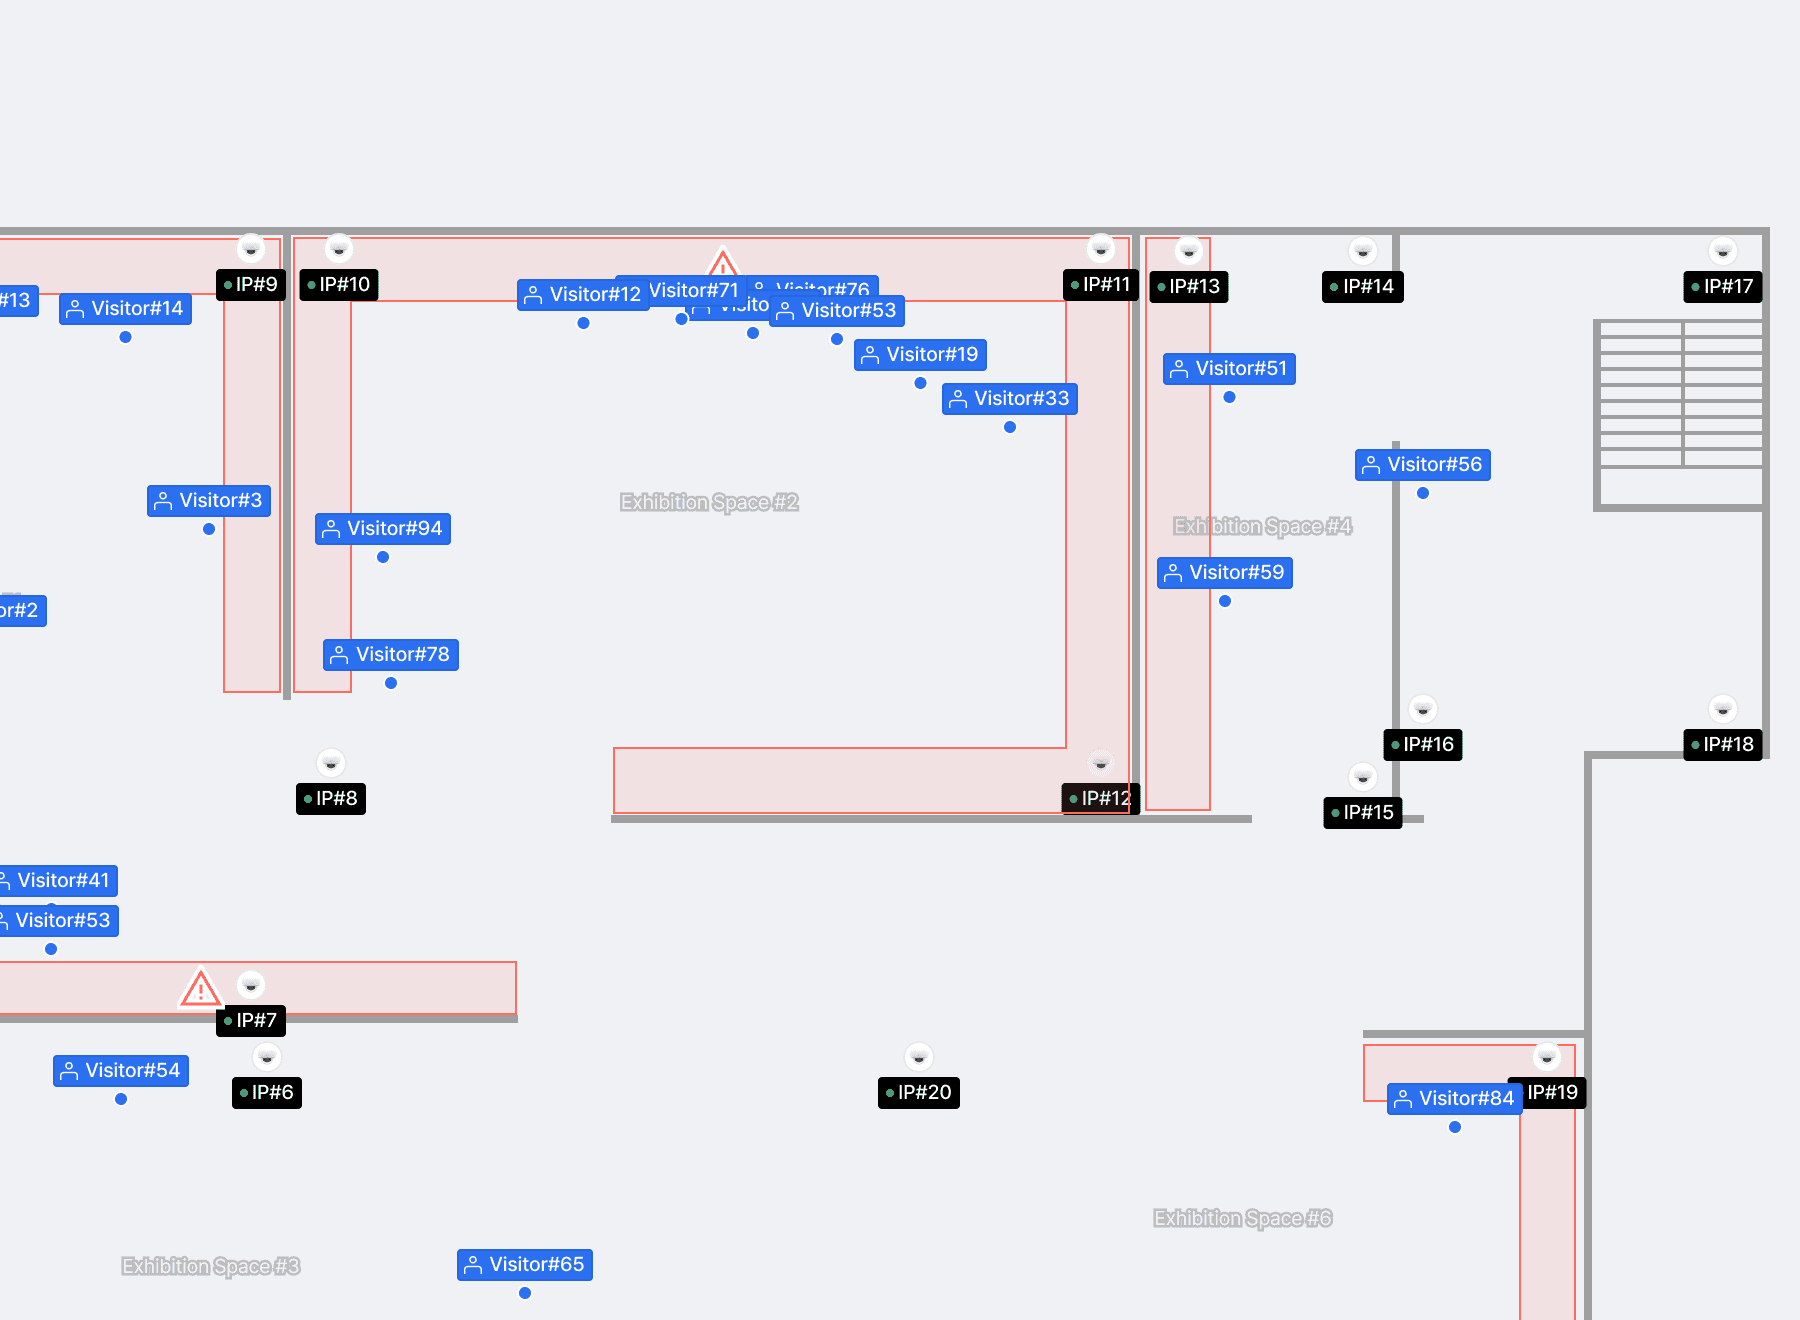
UWB Tag (ID Card) units are handed out so you can see which zone a visitor is in right now. If the aim is totals at zone level, the build stays low in cost, and precise positioning is applied only when interest in each individual exhibit has to be read. The required level is settled first and the technology is chosen after, so nothing is over invested.
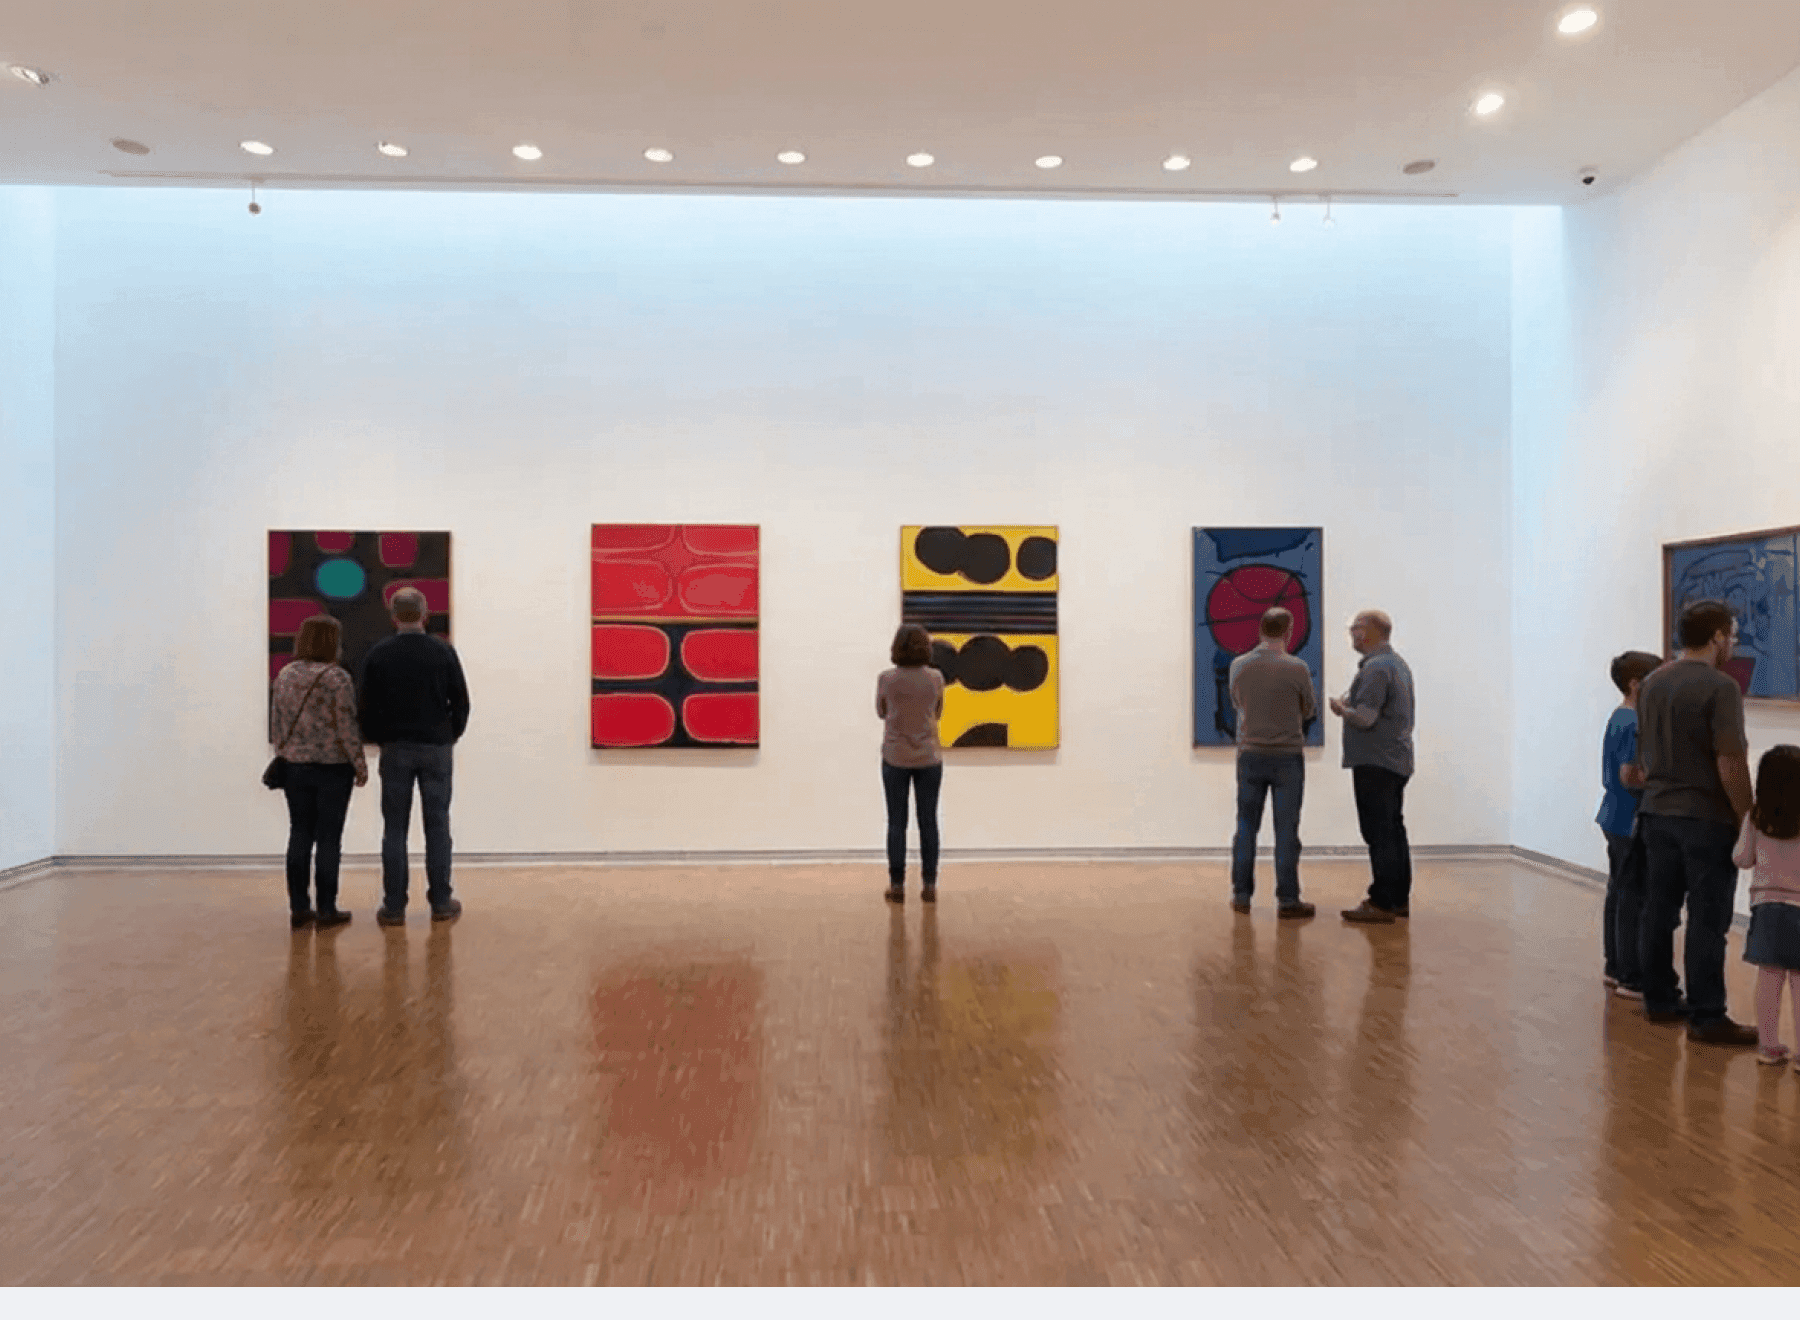
Guidance plays automatically on approach to a work
Offer visitors who enter a work's zone the guidance for that exhibit. When location events are integrated with the content system, the commentary plays on the connected guide device. Zone boundaries and playback range are set so guidance for neighboring works does not overlap.
Movement path sequence from entry to exit
It is recorded which zones the same visitor passed through and in what order. Counting heads at the entrance cannot tell you this, and seeing where people go after a given exhibit gives you grounds to change the layout order. Totals stay anonymous with identity left out, so the personal data burden stays light.
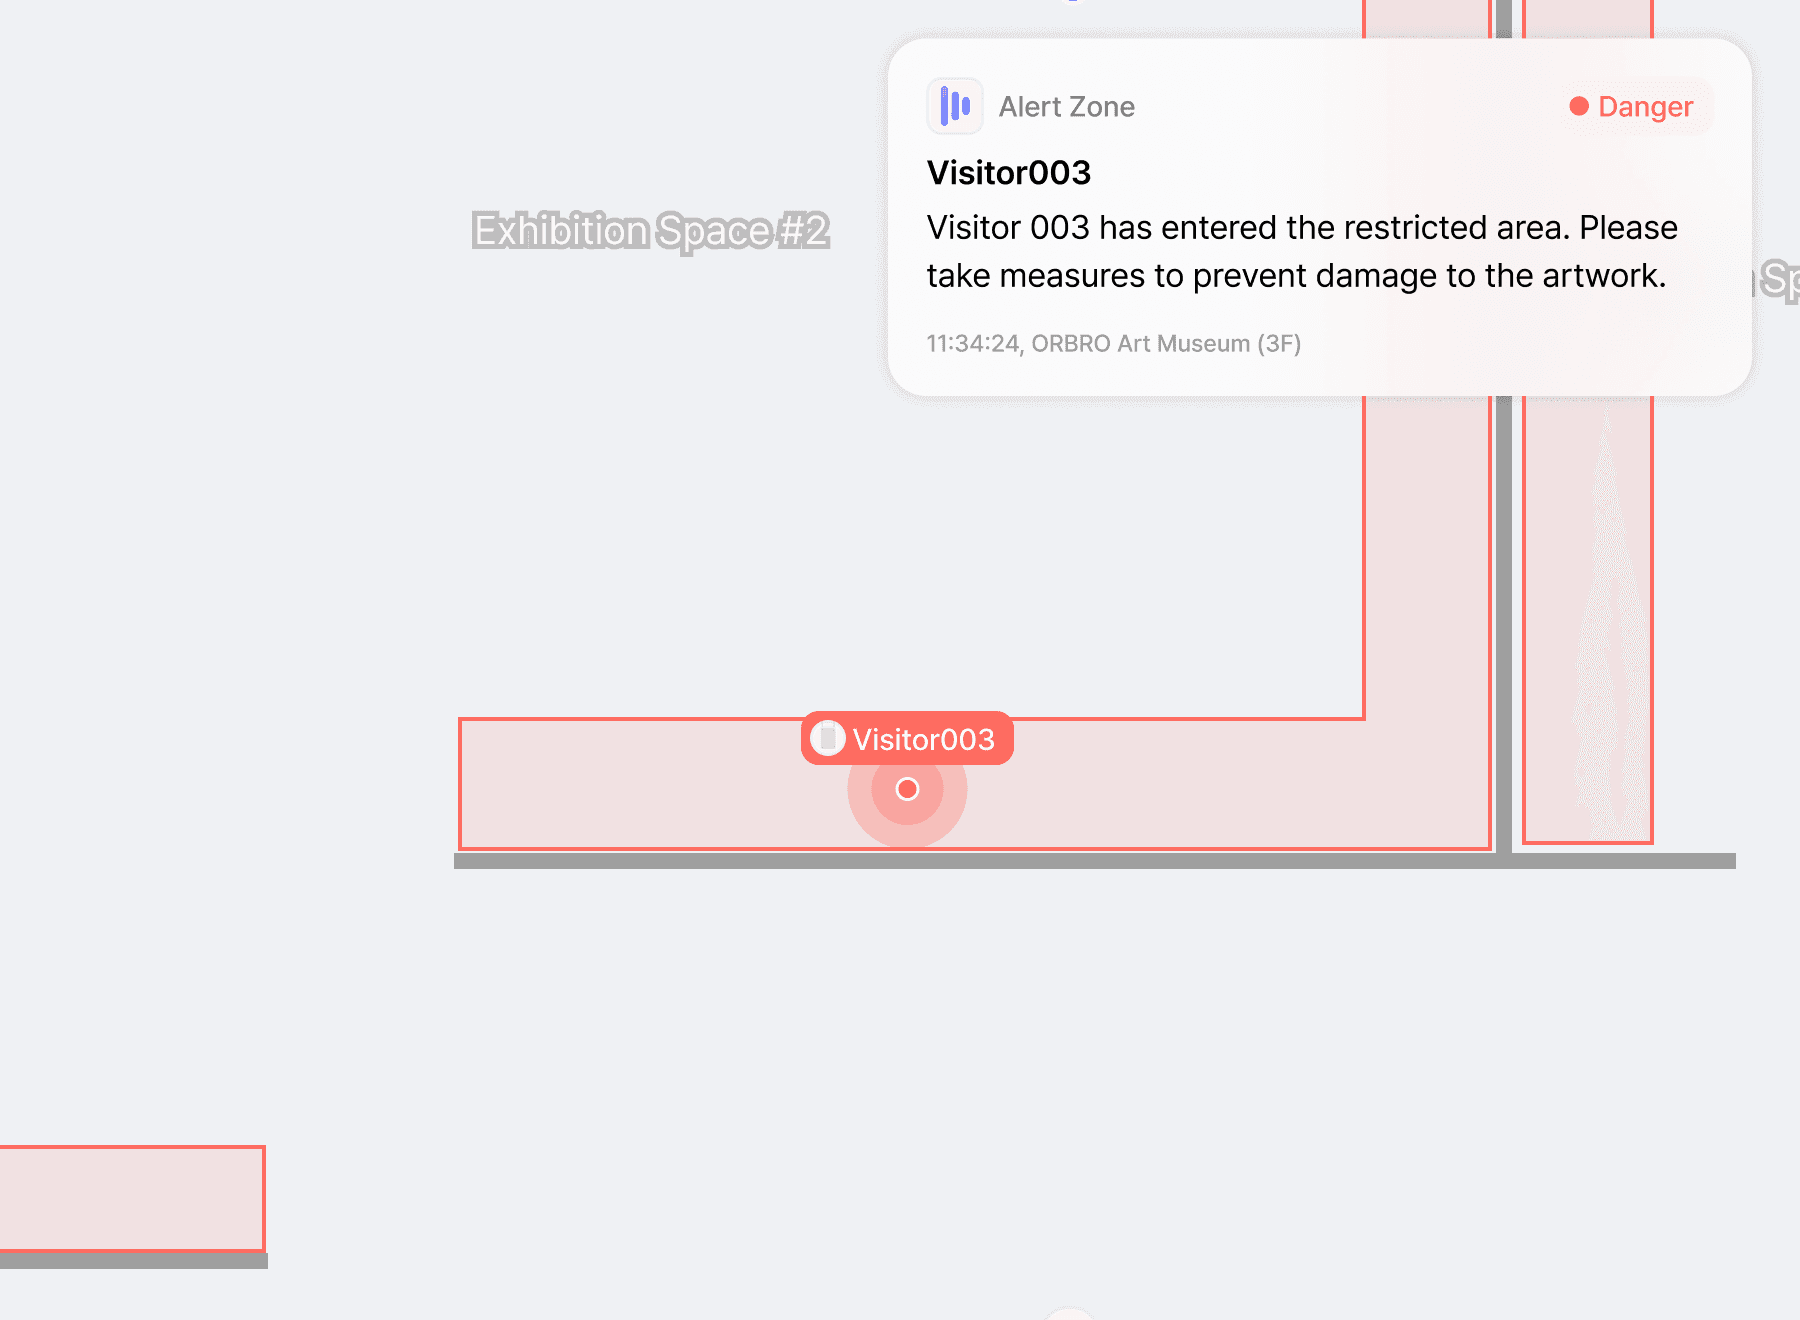
Immediate alert on entry to a restricted zone
Notify the person in charge when a visitor enters a restricted zone. When a tag enters a designated zone a location event is generated and an alert goes to the assigned staff. Permitted conditions and recipients are set per zone so the manager of that space is the one who checks.
Zone-Level Dwell Time Analytics
Zones where people lingered show on a heatmap, and visitor counts and movement paths are generated as a report. Response by shelf in the gift shop and crowding by hour are totaled on the same basis.
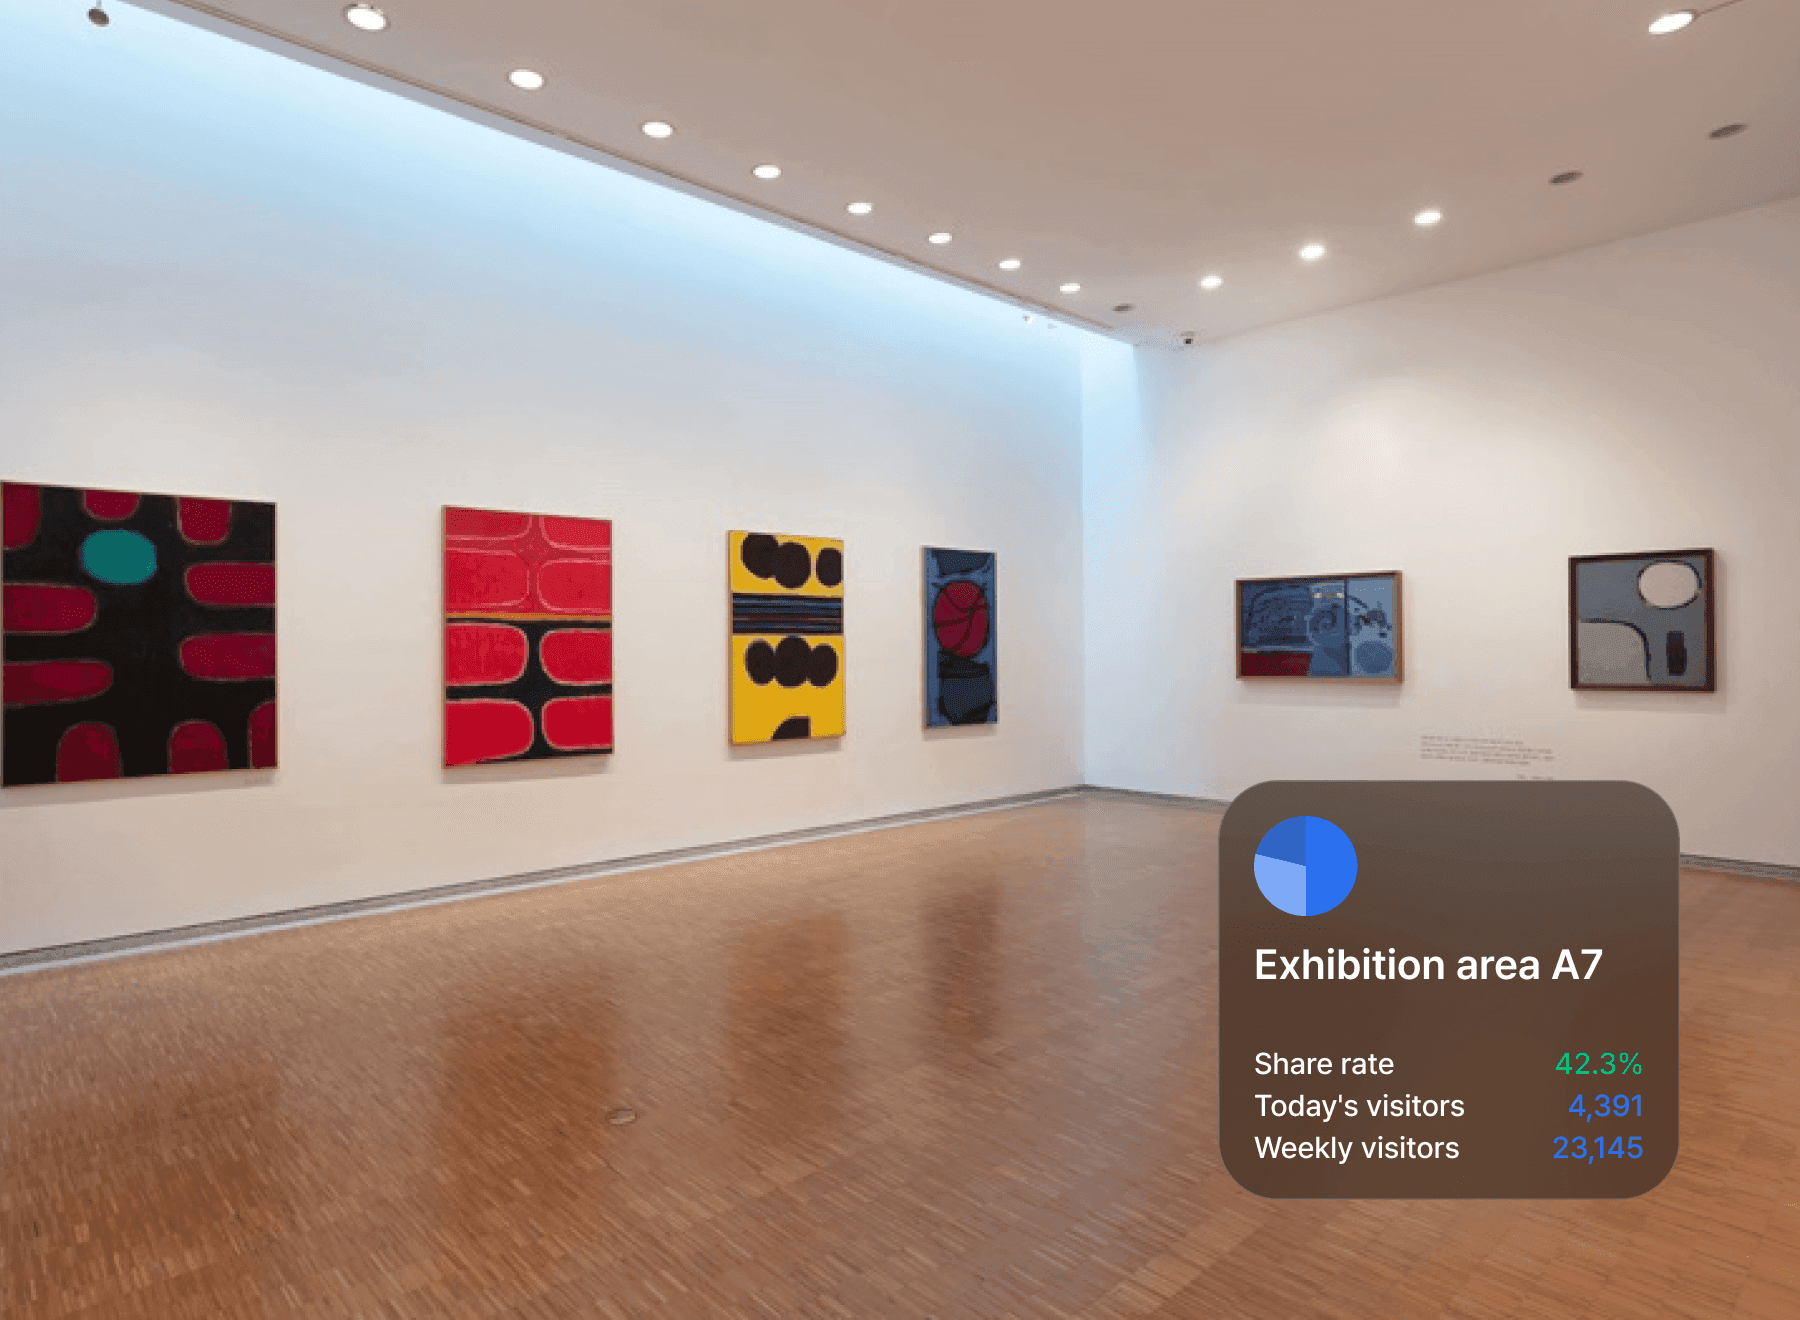
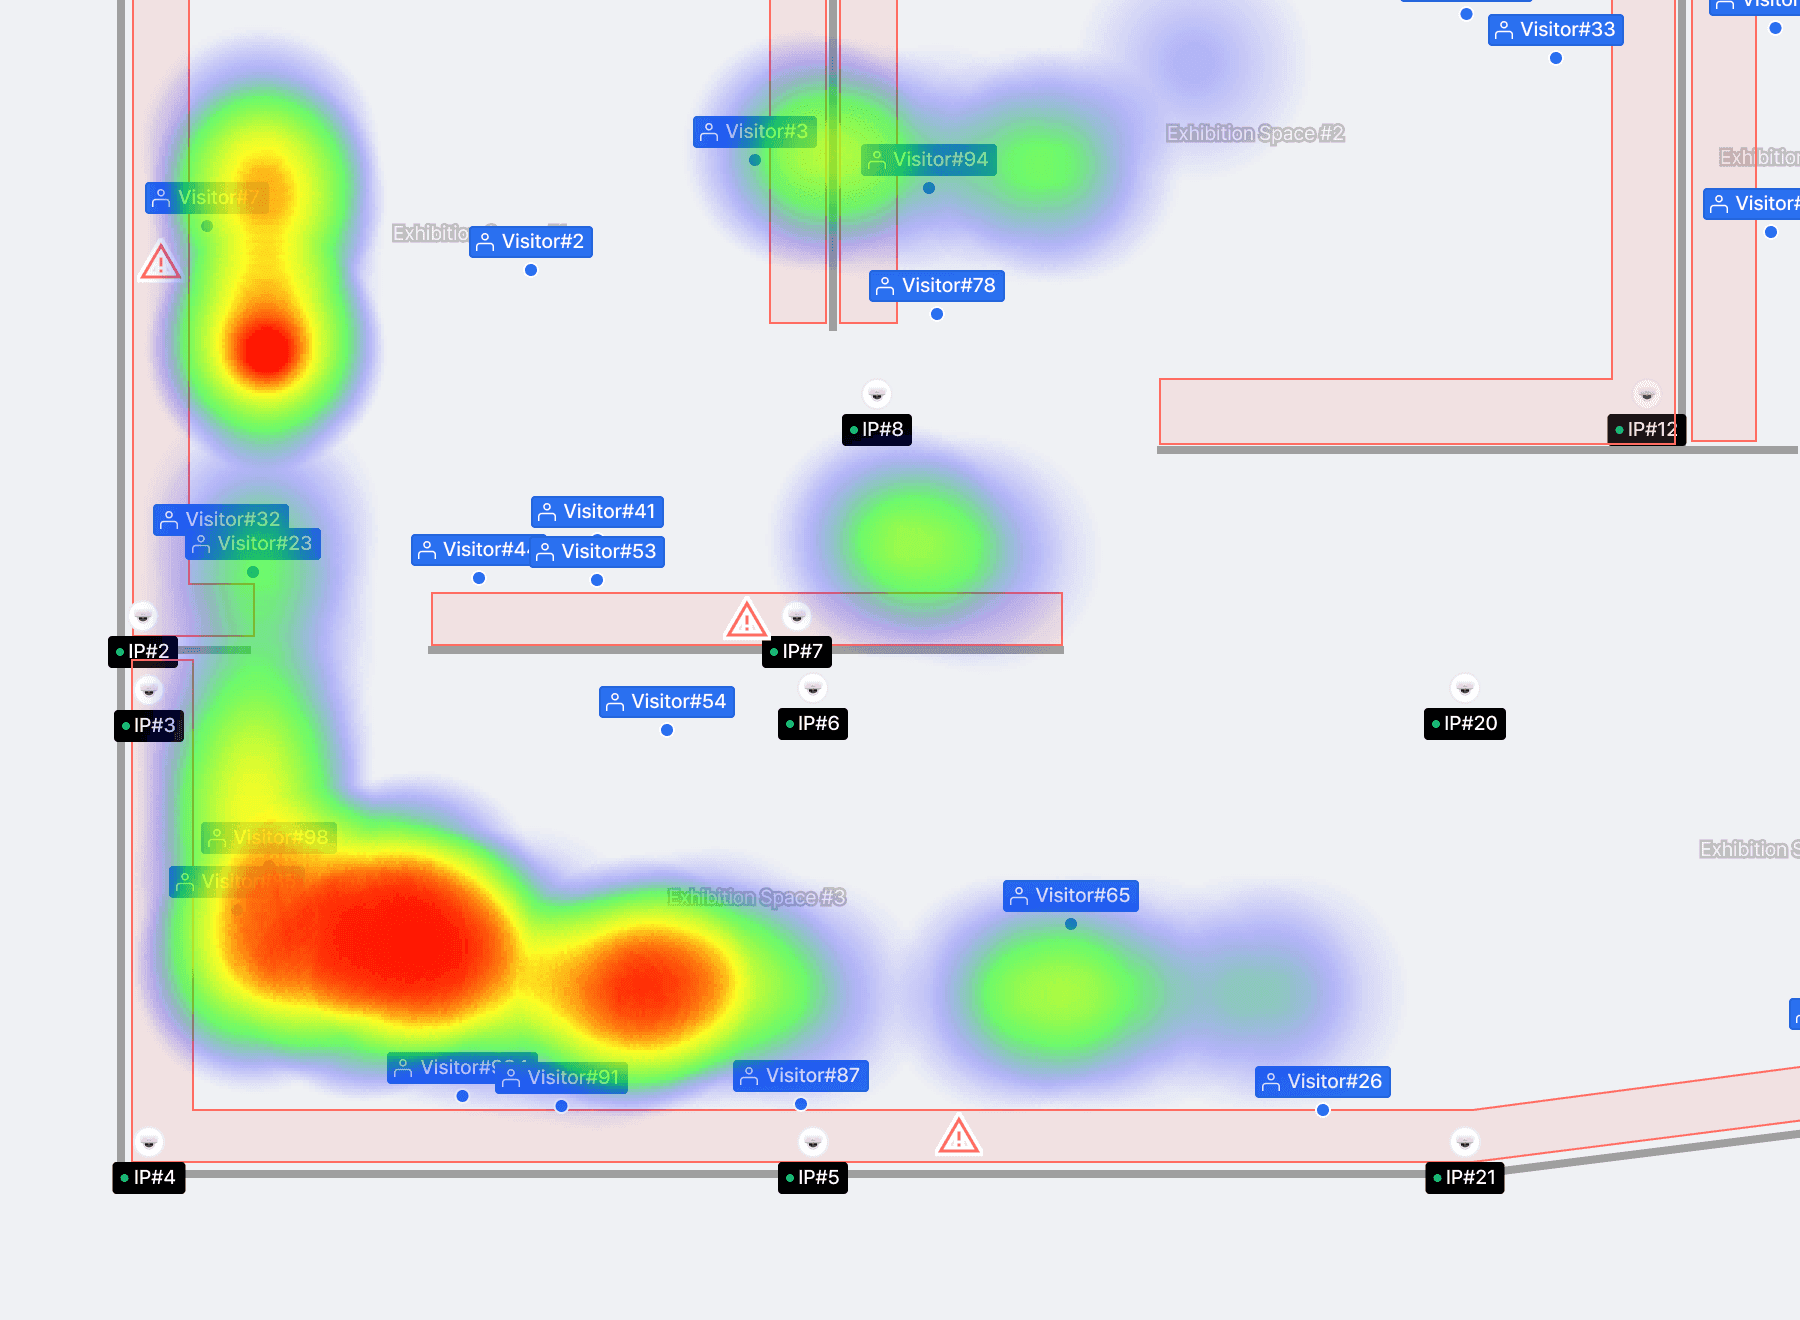
Dwell heatmap by zone
Zones where visitors stayed longest are shown in color, so how the space is occupied is visible at a glance. The heatmap is not only an analysis screen, it is a report page as it stands, and it is used most often to explain the case for reworking an exhibition without reaching for numbers. Comparing separate periods shows the change before and after a rework in the same picture.
Visit analysis reports generated automatically
A report covering visitor counts, dwell time and movement paths by zone is produced automatically on the ORBRO Server. Public facilities need supporting documents to secure a budget for a rework, and with a dashboard alone the staff have to build that document again. Items are arranged to match your existing reporting format and exported to a file.
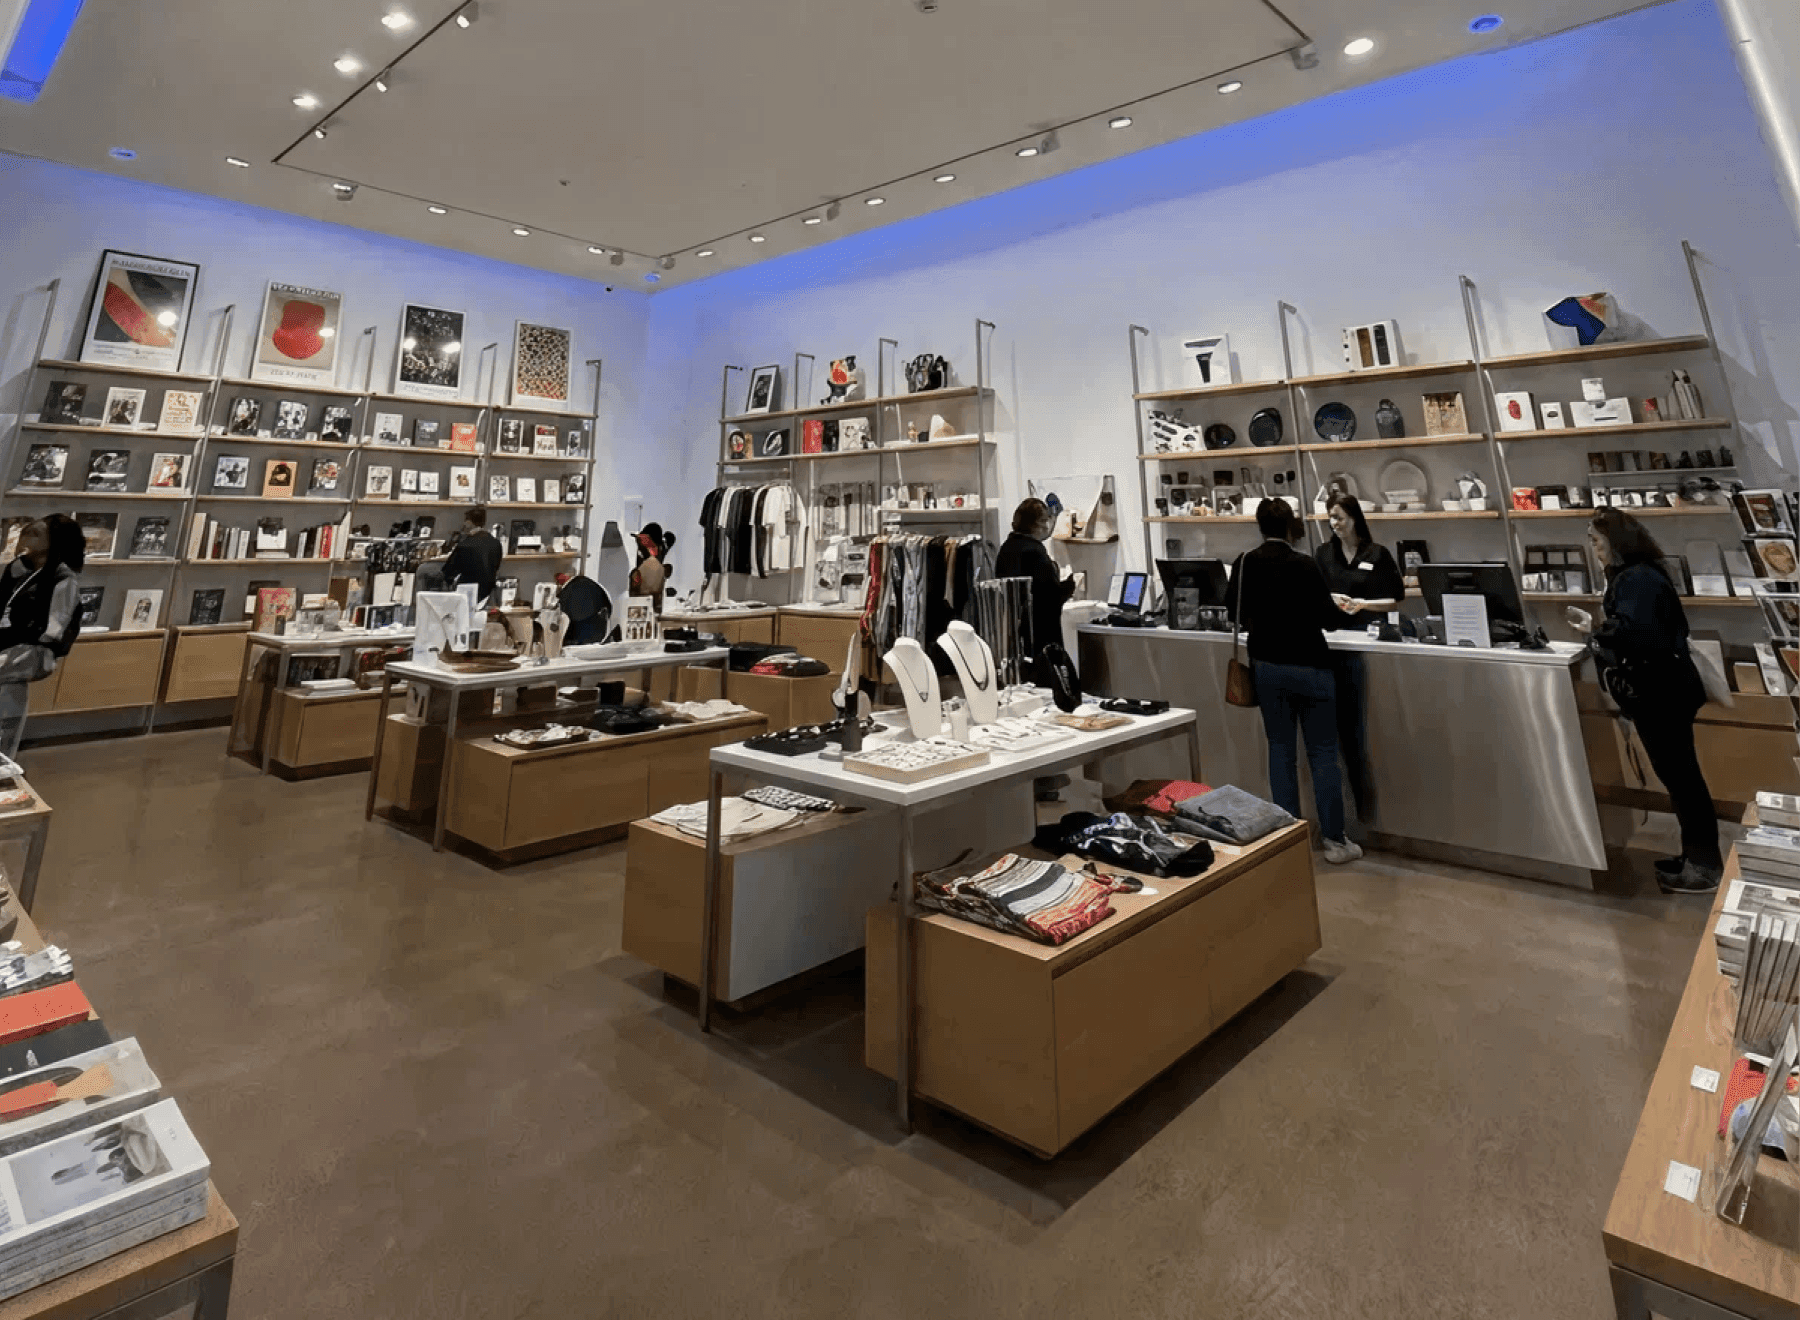
Measuring product response in the gift shop
In the store inside the exhibition, which shelf people stop in front of is measured so you can see the response to each product. A store at the end of the visit route is shaped by the exhibition flow that came before, so it only means something when read together with the exhibition layout. Dwell time is totaled by shelf, which also shows whether a change in display made a difference.
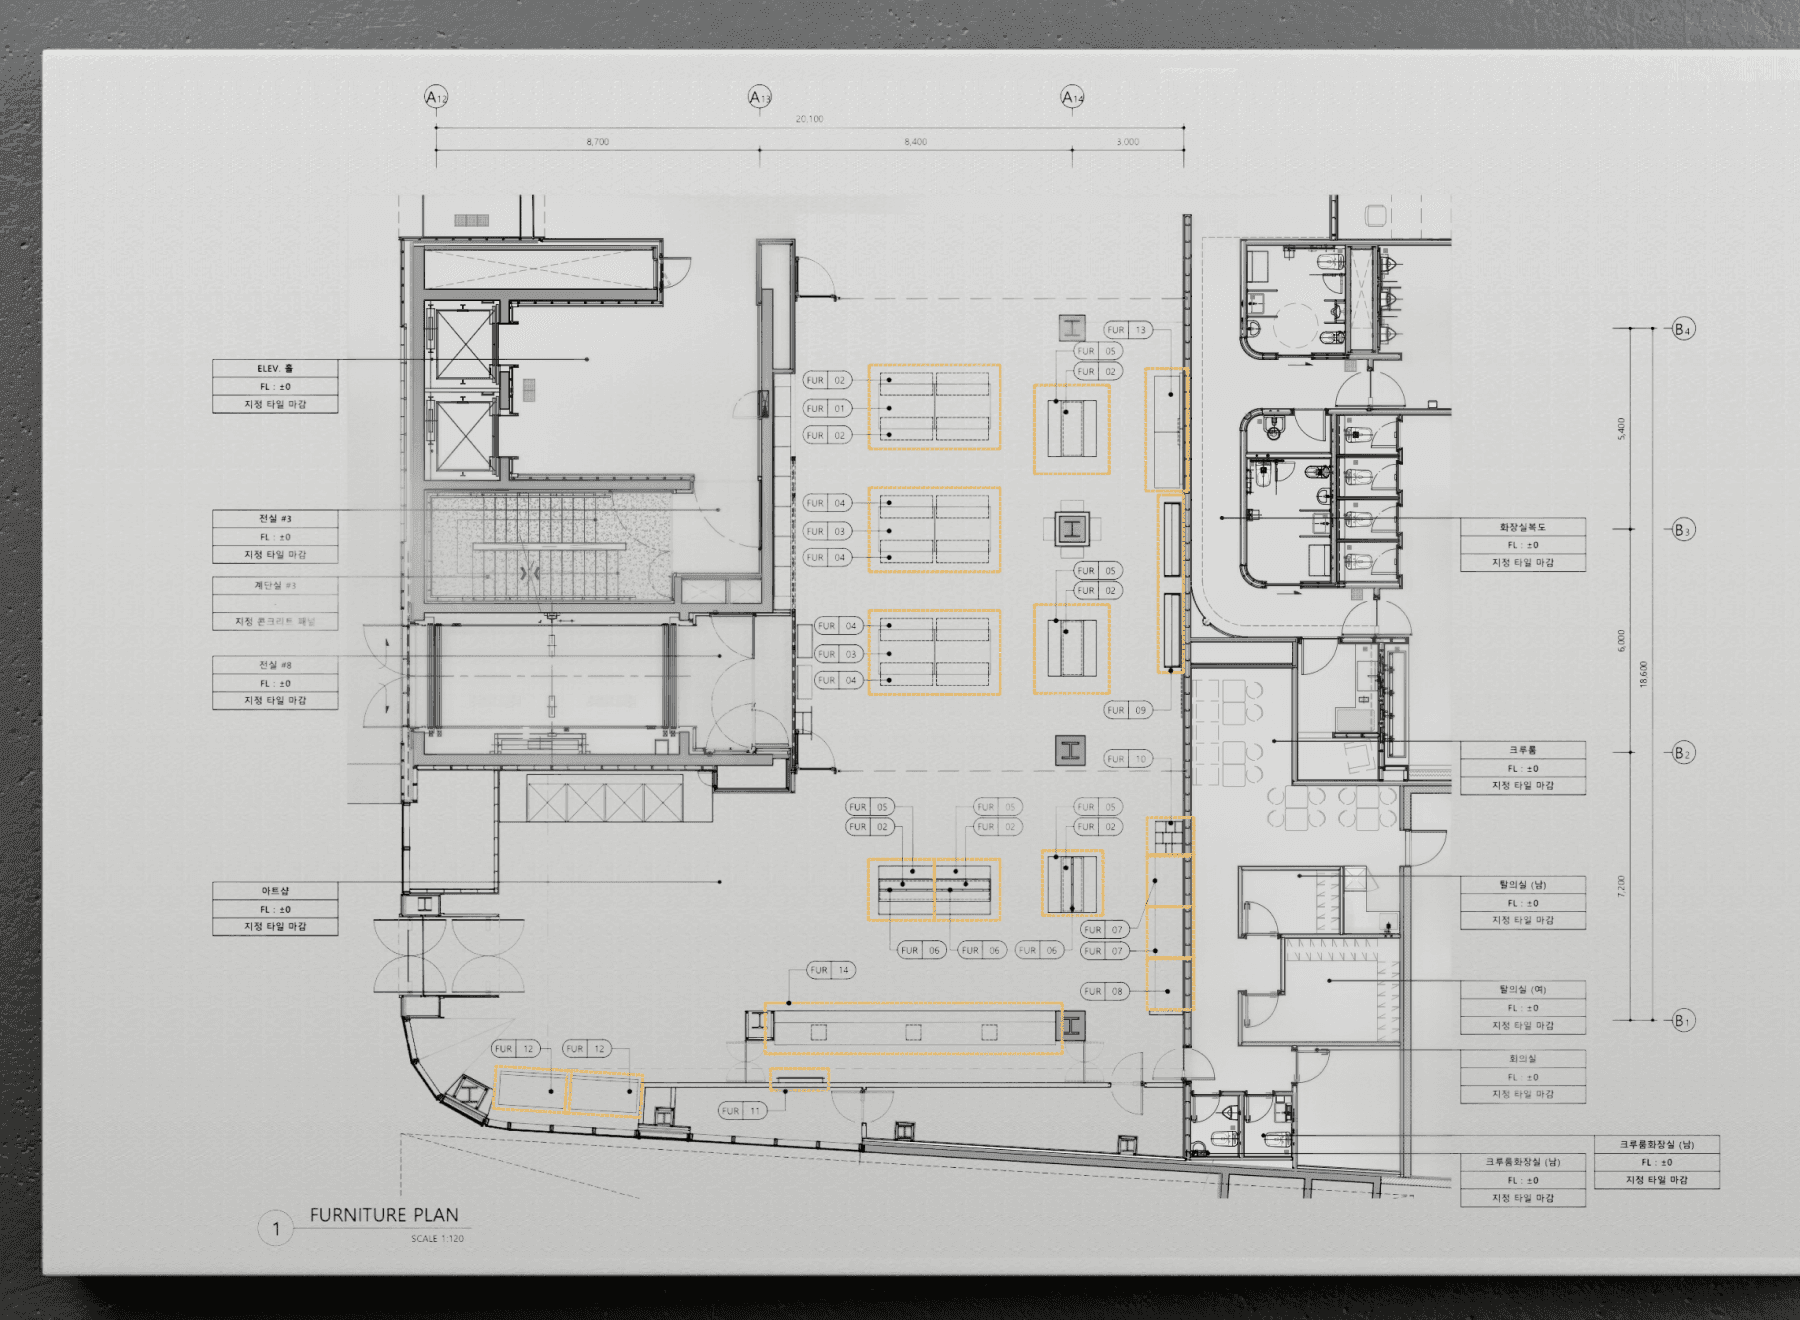
Crowding by time of day
How density by zone changes through the day is displayed. Knowing in advance which hours and zones group visits pile into lets you adjust the guided route and spread people out before a narrow section fills up. Comparing by day of the week and by period also lets you plan staffing for the next special exhibition ahead of time.
Recommended Products
Components Based on ORBRO OS
Each solution operates with various products connected on top of ORBRO OS. Configurations can be flexibly adjusted depending on the scope of application and on-site conditions.
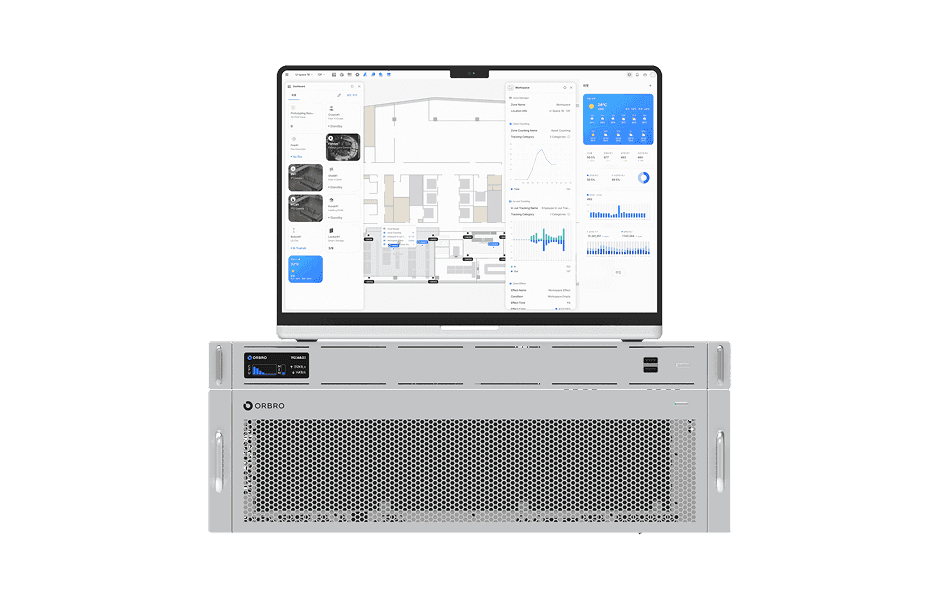
ORBRO OS2
ORBRO OS2
Align location, video, and sensor data on a spatial layer to turn all on-site situations into a single operational workflow.
Learn More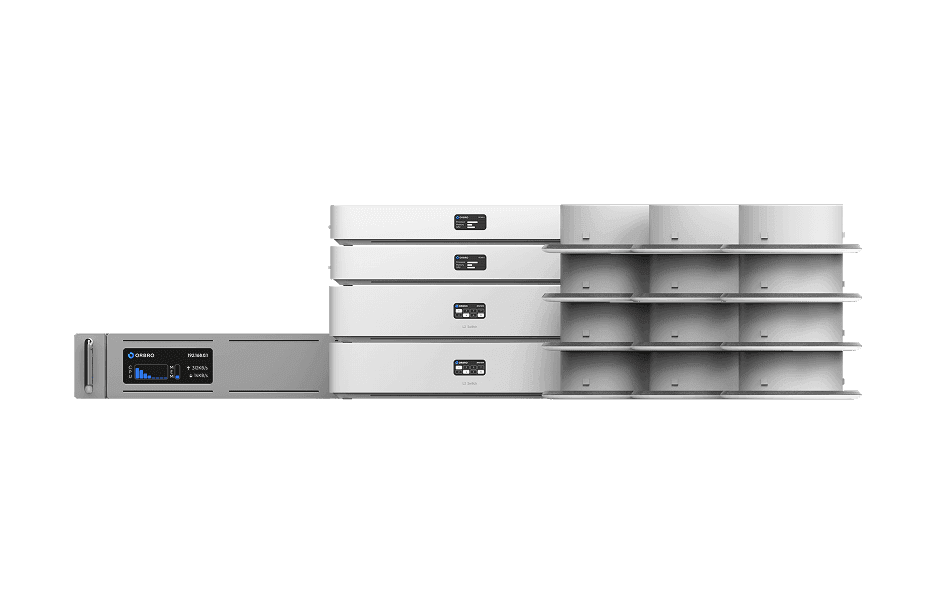
UWB Location Tracking
UWB Location Tracking
Enhance worker safety and precisely manage the movement of assets and equipment through real-time tracking, improving productivity and operational efficiency at the same time.
Learn More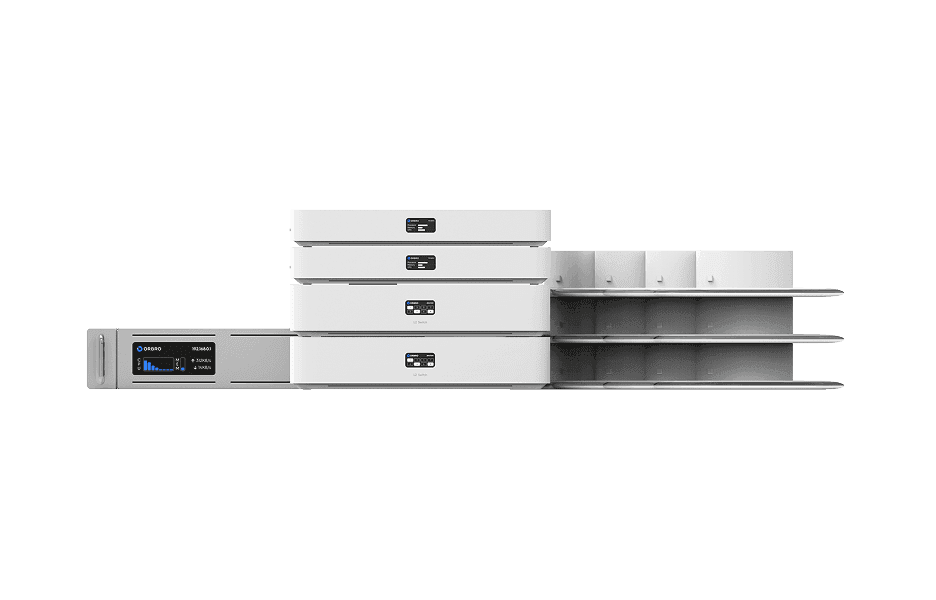
AoA Location Tracking
AoA Location Tracking
Beyond simple coordinates, this solution leverages signal angles to precisely identify movement direction and paths. It supports access control, enhanced security, and customer flow analysis as a next-generation RTLS solution.
Learn More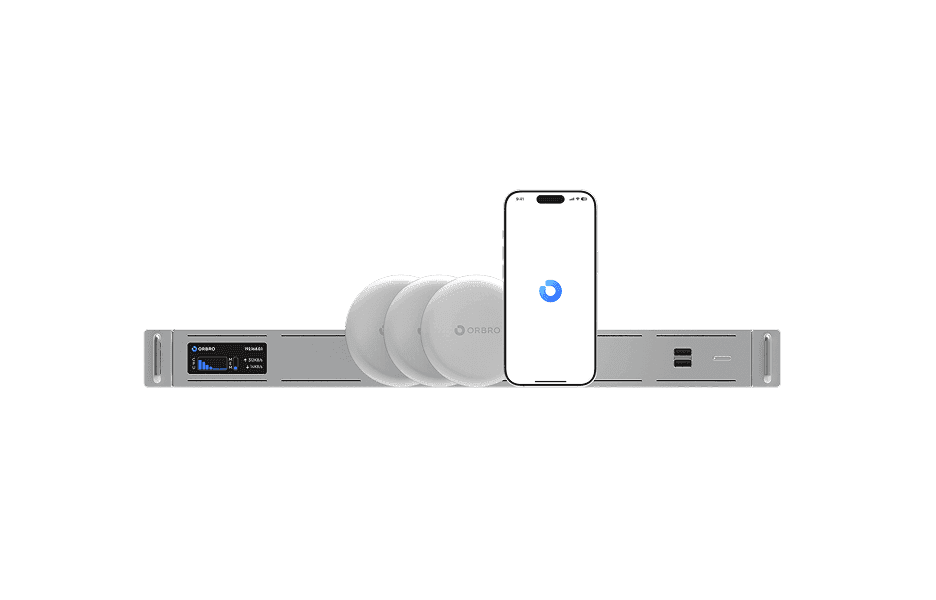
Mobile Location Tracking
Mobile Location Tracking
Smartphones automatically detect nearby beacon signals to determine location, enabling real-time visibility across indoor and outdoor areas without dedicated readers or equipment.
Learn More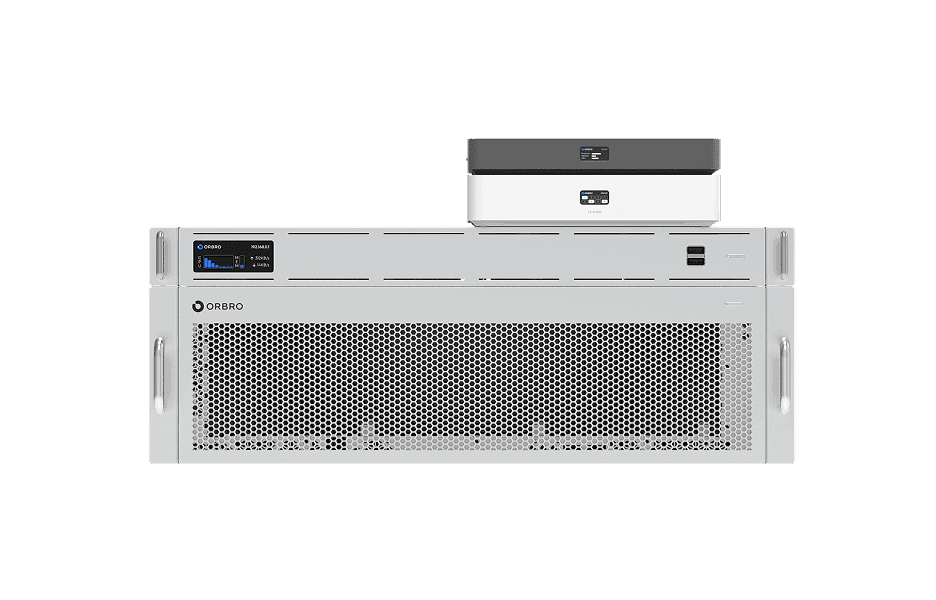
Video-based Location Tracking
Video-based Location Tracking
Analyze camera footage to convert movements of people and vehicles into coordinates, providing map-based real-time tracking along with path and dwell-time analysis.
Learn More