Monitoring Begins the Moment You Draw a Zone — Ten Location Tracking Apps
2026-08-05
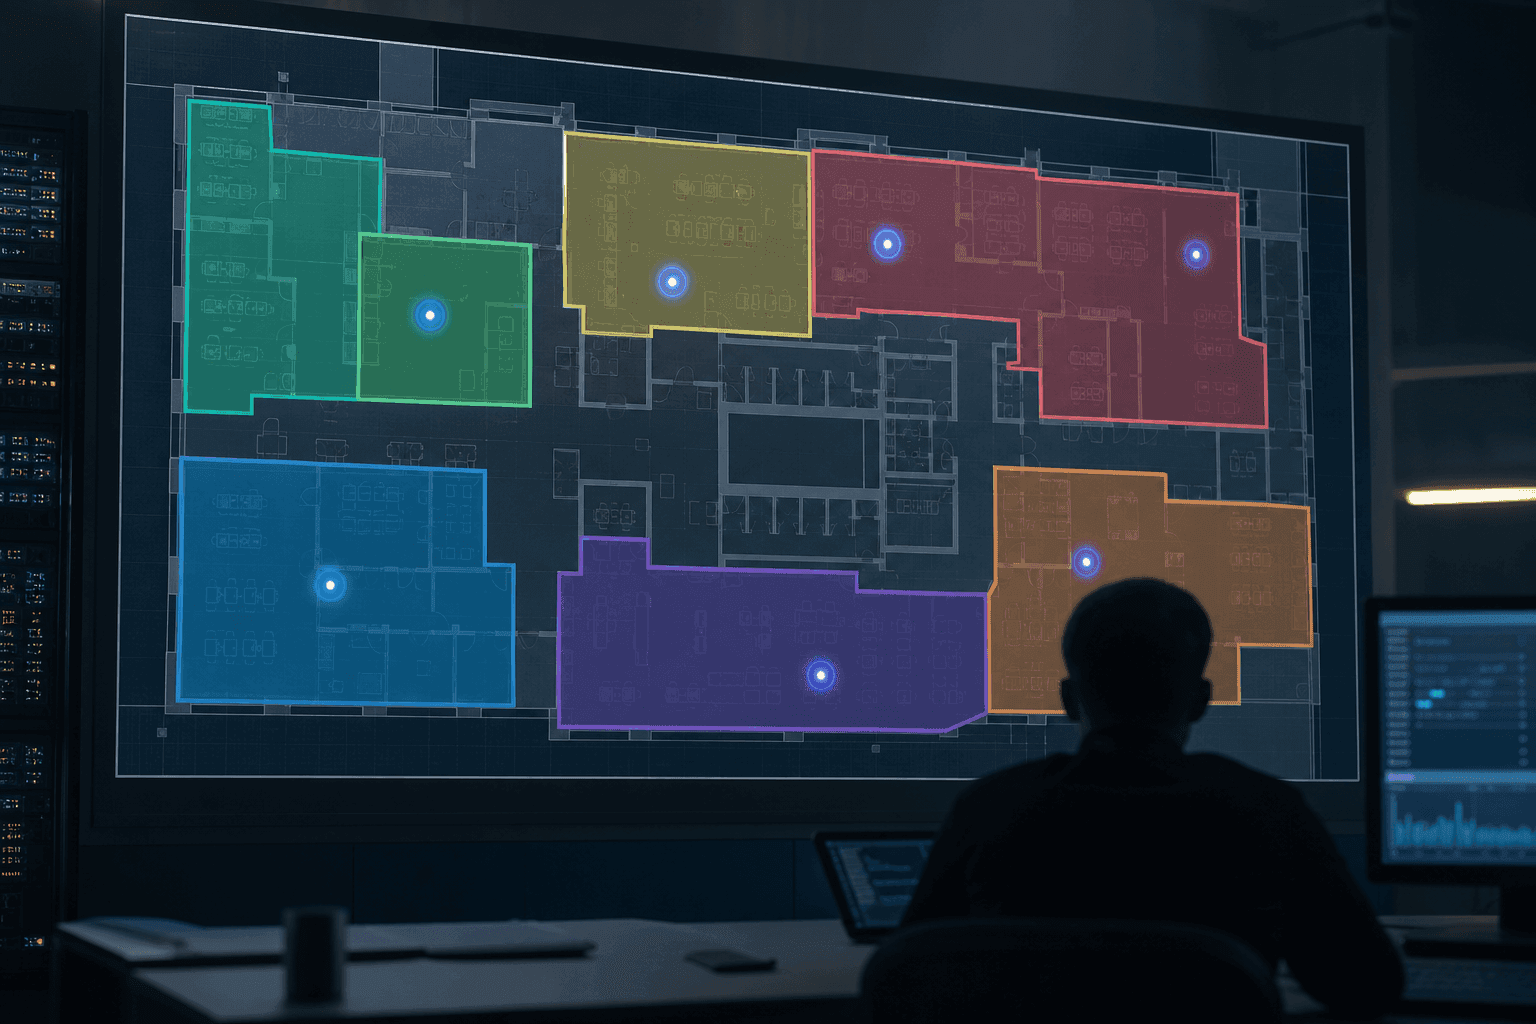
On the day real-time location tracking (RTLS) is first switched on, the most common reaction on site is not admiration but a question. Dots appear on the floor plan and actually move. A person walks and the dot walks. And about five minutes later the manager asks: "So what do we do with this?"
A fair question, because a coordinate is not information on its own. The fact that some tag is at some point on the plan tells you nothing unless the system knows whether that point is a material staging area, a walkway, or a restricted zone.
So the first thing you do when starting location tracking in ORBRO OS is not switching on tags. It is drawing lines on the floor plan.
This instalment of the ORBRO OS Story covers the platform's thickest category: the ten location tracking apps. To say it up front, nine of the ten run on top of the lines drawn by the first one.
I. The App That Draws the Lines — Zone Manager
Zone Manager draws operational zones on a floor plan. Eight tools — rectangle, polygon, freehand pen, move, rotate, eraser, undo and more — let you make the shape you want and name it. What results is not a picture on the plan but polygon coordinate data.
For a sense of scale: one floor of our own office has 33 zones registered. One for each unit that has to be looked at separately in operation — meeting rooms, the cafeteria, the showroom, corridors.
What matters is that zones do not care what kind of plan they sit on. An indoor vector drawing, an outdoor plaza on a city map, an aerial photograph of an industrial site — the way you draw a zone is identical. Indoor and outdoor can be handled in the same grammar.
Zone Manager is the one app you cannot switch off in ORBRO OS. Every workspace can disable apps it does not need and clear them off the screen, but this one has its toggle locked. The other nine live on the data it produces.
One practical note: name your zones properly the first time. Zone names go straight into notification text later. "Entry detected in Zone 07" and "Entry detected in Line 3 press hazard zone" are entirely different messages to someone receiving a text at two in the morning.
II. Once There Is a Zone, Counting Starts
Define a zone and the first question appears. How many are in there now?
Zone Counting answers it. Specify a zone and a tracking category and it shows current and cumulative counts as cards, with change over time as a graph. The trick with this app is that you can attach several instances to the same zone. Register "people count" and "asset count" separately on one cafeteria and you can watch the same space through two lenses at once.
The second question is direction. In some places how many entered and left matters more than how many are present.
In-out Tracking draws a reference line inside a zone and designates which side is IN and which is OUT. Anything crossing that line is classified as entry or exit by direction, and stacked into an hourly bar chart from midnight to midnight. Use it at doorways, gates, and corridors — wherever flow passes through.
Reverse Tracking uses the same reference line for the opposite purpose. Set the normal direction of travel and it catches only what goes against it. A forklift coming up a one-way aisle, a vehicle entering an exit-only ramp. It does not log normal flow, only deviations — so the mere fact that records are accumulating is itself the warning.
There is one trap that must be flagged. Set the reference line's direction backwards and the results invert wholesale. Entries become exits, wrong-way travel becomes normal traffic. The system does not raise an error; it quietly returns the wrong answer. We recommend a procedure where a person physically walks through right after installation to confirm the direction is correct. Five minutes of work saves months of data.
III. Zones Also Warn
After counting comes alerting.
Alert Zone has the simplest structure. Link one zone to one target category and an alarm fires the moment that target enters. Because you do not have to construct a complex condition expression, you can drop it straight onto restricted zones, controlled areas, and the surroundings of dangerous equipment — anywhere that is a "must not enter." Occurrences accumulate chronologically and export to Excel.
Zone Effect alerts differently. Not a text or a popup — it changes the map itself. When the condition is met, that zone flashes or darkens on the floor plan. Whoever is watching the monitoring screen does not have to read an alert list; they look at the part of the map that is blinking. You can fix a duration such as five seconds, or hold it until the condition clears.
The difference between these two apps is how ORBRO OS treats warnings. Urgent things by sound and vibration; states by colour on screen. Push both into the same alert list and eventually nobody reads the list.
One addition: the "condition" Zone Effect responds to is not a concept confined to the location tracking apps. Conditions in ORBRO OS are managed at five levels — emergency, warning, caution, attention, normal — and a single condition is used simultaneously along three branches: notification, screen effect, and response procedure. That structure is examined in detail in the article on the AI apps.
IV. The Questions You Ask Afterwards
Half of monitoring is real time; the other half is retrospective. When an accident happens, when stock goes missing, when you want to improve movement flow, what you need is not now but then.
Timeline retraces a day from the perspective of one tag. It shows which zones that tag was in at which times as a time-axis graph, and exports how long it stayed in each zone to Excel. Because the history is at zone granularity it reads easily.
Record is finer. The name gets mistaken for video recording, but what Record stores is location data. Set a space and a time span, record from one to twelve hours, and you can later replay the movement of that period on the map. Playback speed is adjustable. Because it works at coordinate granularity rather than zone granularity, you can see exactly how something moved inside a zone boundary.
The relationship between the two sums up like this: where and for how long is Timeline; how it moved is Record. In accident investigation you generally look at both.
Heatmap looks at the space rather than the object. Set a period and it paints the places where activity concentrated as density on the floor plan. You can replay it split by time interval, and export the change as a GIF. Which corridor is actually congested, how long people stand in front of a machine — things the floor plan alone cannot tell you surface here.
One caveat: Heatmap's query range is the most recent 8 days including today. If you need month-over-month comparison, you need an operating routine that exports periodically and stores the results separately. It is a constraint with no reason to hide, so we say it in advance.
V. When Identity Is Required — Access
The nine apps so far share one thing: they do not ask who. Location data moves by tag and category; it does not verify that the person is a specific individual. For headcount and movement analysis this is actually preferable.
But there is a moment when identity is essential. Access control.
Access handles authentication events. When authentication occurs at an access device, it records who passed which door and when, and aggregates first entry time, last entry time, total dwell time, and entry count per user. You can filter by user, group, and access policy.
Elevator integration also belongs to this app. Register a linkage rule and the car for the relevant floor is called at the same moment access is authenticated. A structure where nobody has to press a button.
In-out Tracking and Access look similar at a glance but differ in nature. In-out Tracking counts flow without authentication; Access leaves an identity through authentication. Footfall in a plaza belongs to the former, an office entry log to the latter. Overlay the two and you can also cross-check whole-building dwell time against per-zone dwell time.
What to Settle First When Deploying
No site switches on all ten apps. In practice this order is faster.
First, draw the zones first. Before choosing apps, put the floor plan down and decide the units that have to be distinguished operationally. If this work is sloppy every result downstream is sloppy.
Second, write the question you want to ask as a sentence. "How many people are on line 3 right now" is Zone Counting; "how many passed the gate" is In-out Tracking; "who entered the hazard zone" is Alert Zone. Once the question is settled the app settles itself.
Third, verify apps that use a reference line immediately after installation. Because of the direction problem above.
Closing
The worth of a location tracking system is not decided solely by how precisely the dots land. Half of it is what meaning has been assigned to the place those dots pass through.
Nine of the ten apps run on the lines drawn by the first one. Counting, warning, retracing — all of it requires a zone to exist. Which is why in ORBRO OS the first day of a location tracking deployment is not the day you hand out tags, but the day you spread out the floor plan and agree that from here to there is one zone.
The camera story is separate: four AI apps that read the site without anyone watching, and an article on what actually has to happen after something is detected.
If you would like to review zone design for your site together, get in touch with ORBRO.
Recommended Blogs

OSHA Heat Rule 2026: What Is Proposed, What Is Already
2026-08-31

OSHA Warehouse NEP Renewed for Five Years, What Inspectors Check
2026-09-01

Emergency Action Plan Requirements, Accounting for All Employees After Evacuation
2026-09-02

Struck-By Hazards in Construction, Managing the Distance Between Workers and Heavy Equipment
2026-09-04
Patient Elopement Detection, Start With the Exit Routes, Not the Whole Ward
2026-09-11